- What is MACD and why traders love it
- The three parts of MACD explained
- Reading MACD crossovers — the classic signal
- The histogram: MACD's most overlooked power
- MACD divergence — spotting reversals early
- Three complete MACD strategies with setups
- Five MACD mistakes that cost traders money
- Combining MACD with other tools for confluence
- Frequently asked questions
What is MACD and why traders love it
If RSI answers "has price moved too far, too fast?", then MACD answers a different and equally important question: is momentum shifting right now? The Moving Average Convergence Divergence (MACD) indicator was developed by Gerald Appel in the late 1970s, and despite dozens of newer indicators being invented since, MACD remains the single most widely used momentum tool in trading — rivaled only by RSI itself.
For Indian crypto traders, MACD has a special appeal. It works beautifully on 4H and daily charts, it does not require you to remember multiple levels (no "70" or "30" to memorize), and its signals are visual and unambiguous. When two lines cross, they cross. There is no grey area.
But MACD is also the indicator most misused by retail traders. The majority trade only the crossovers — and lose money. This guide will show you why crossovers alone are not enough, and how professionals extract real edge from the indicator.
The three parts of MACD explained
MACD has three visual components. Each tells you something different, and understanding all three separates casual users from serious analysts.
1. The MACD Line. This is the main line, typically drawn in one color (often gold or blue in dark-theme charts). It is calculated by subtracting a 26-period EMA (exponential moving average) from a 12-period EMA. When the fast 12-EMA is above the slow 26-EMA, MACD line is positive (above zero). When fast is below slow, MACD is negative.
2. The Signal Line. This is a 9-period EMA of the MACD line itself. It is slower and smoother, acting as a reference. It is usually drawn in a contrasting color (often amber or red).
3. The Histogram. These are the vertical bars, showing the difference between MACD line and signal line. When MACD line is above signal line, histogram bars are positive (often green). When MACD is below signal, bars are negative (often red). The taller the bar, the wider the gap between the lines — meaning stronger momentum.
All three read together give you a complete momentum picture. If you only watch the MACD line, you miss half the signal. Good traders check all three every time.
Reading MACD crossovers — the classic signal
The two most-watched signals in technical analysis are MACD crossovers. There are two types:
Bullish crossover: MACD line crosses above the signal line. Momentum is turning up. If this happens below the zero line (during a pullback or downtrend), the signal is considered particularly strong because it suggests the start of a new up-phase.
Bearish crossover: MACD line crosses below the signal line. Momentum is turning down. If this happens above the zero line (during an uptrend), it suggests the up-move is losing steam and a pullback or reversal may be coming.
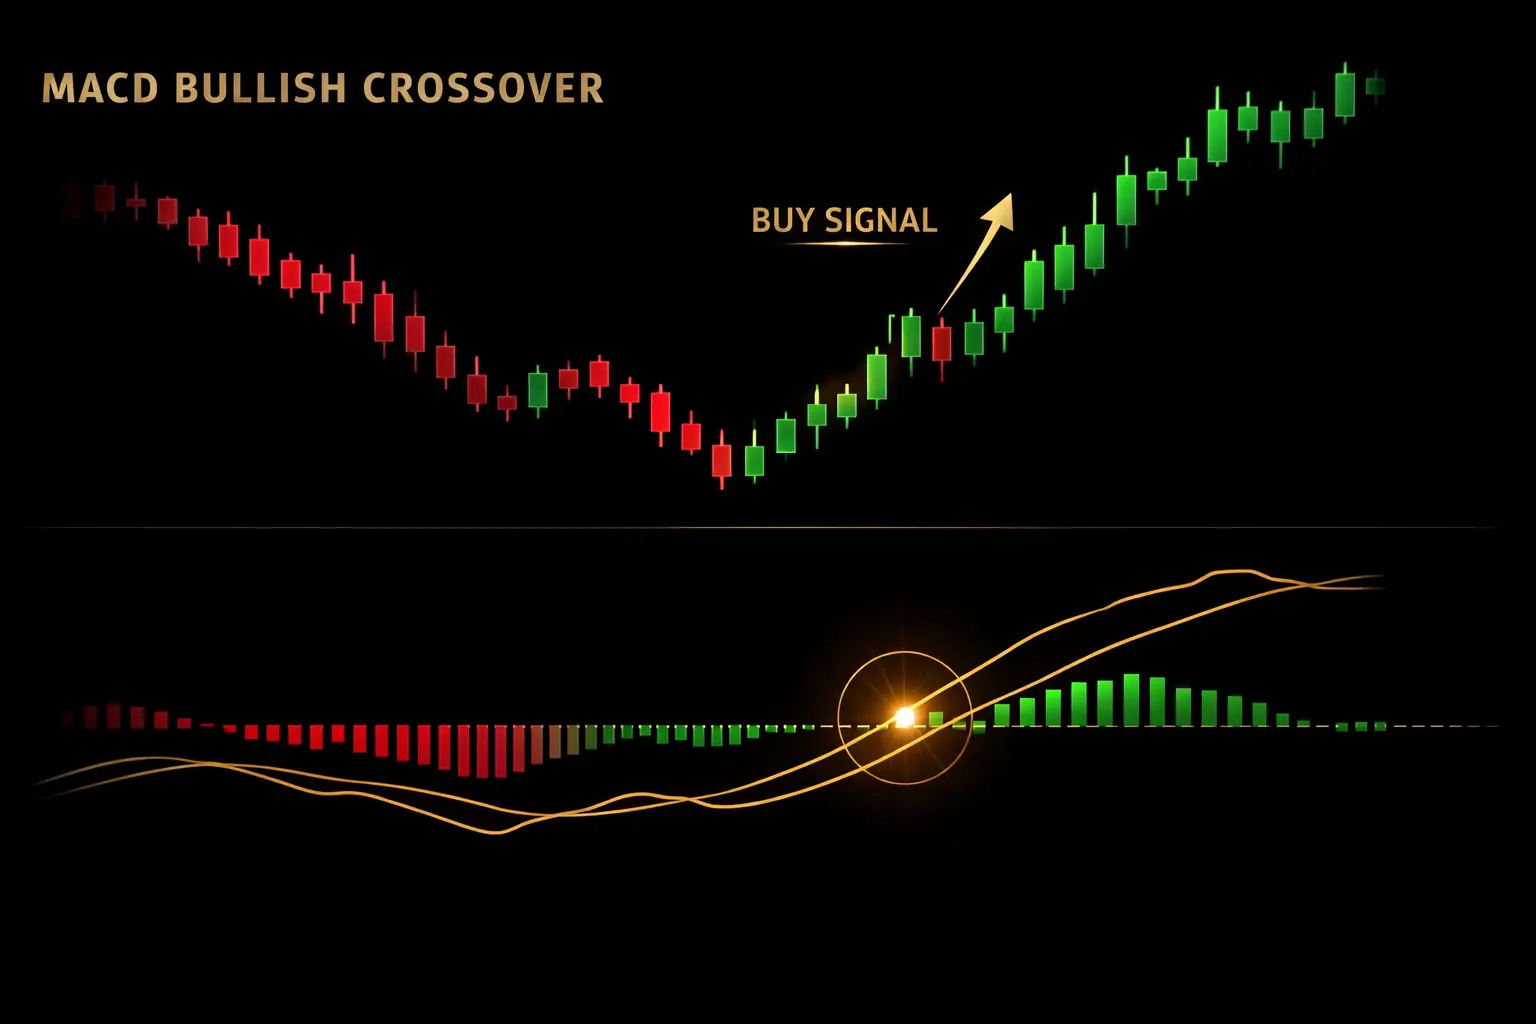
The anatomy of a MACD bullish crossover: the MACD line crossing above the signal line, confirmed by the price chart turning up.
But here is the catch every retail trader discovers after a few losses: not all crossovers are equal. In sideways choppy markets, MACD whipsaws back and forth, producing half a dozen false crossovers in quick succession. Each one looks valid in isolation, each one fails.
The filter that separates real signals from noise is the zero line. Bullish crossovers that happen just before or at the zero line (moving from below to above) are far more reliable than bullish crossovers that happen while MACD is still deep in negative territory. Similarly, the most powerful bearish crossovers are those that happen near zero, suggesting a trend change.
The histogram: MACD's most overlooked power
Ask ten traders what they watch on MACD and most will say "the crossover". Ask a professional, and they will say "the histogram". Here's why.
The histogram tells you the rate of change of momentum. Growing bars mean momentum is accelerating. Shrinking bars — even before the lines actually cross — mean momentum is fading. A skilled trader can often see a trade turning against them through histogram contraction 2-3 candles before an official crossover.
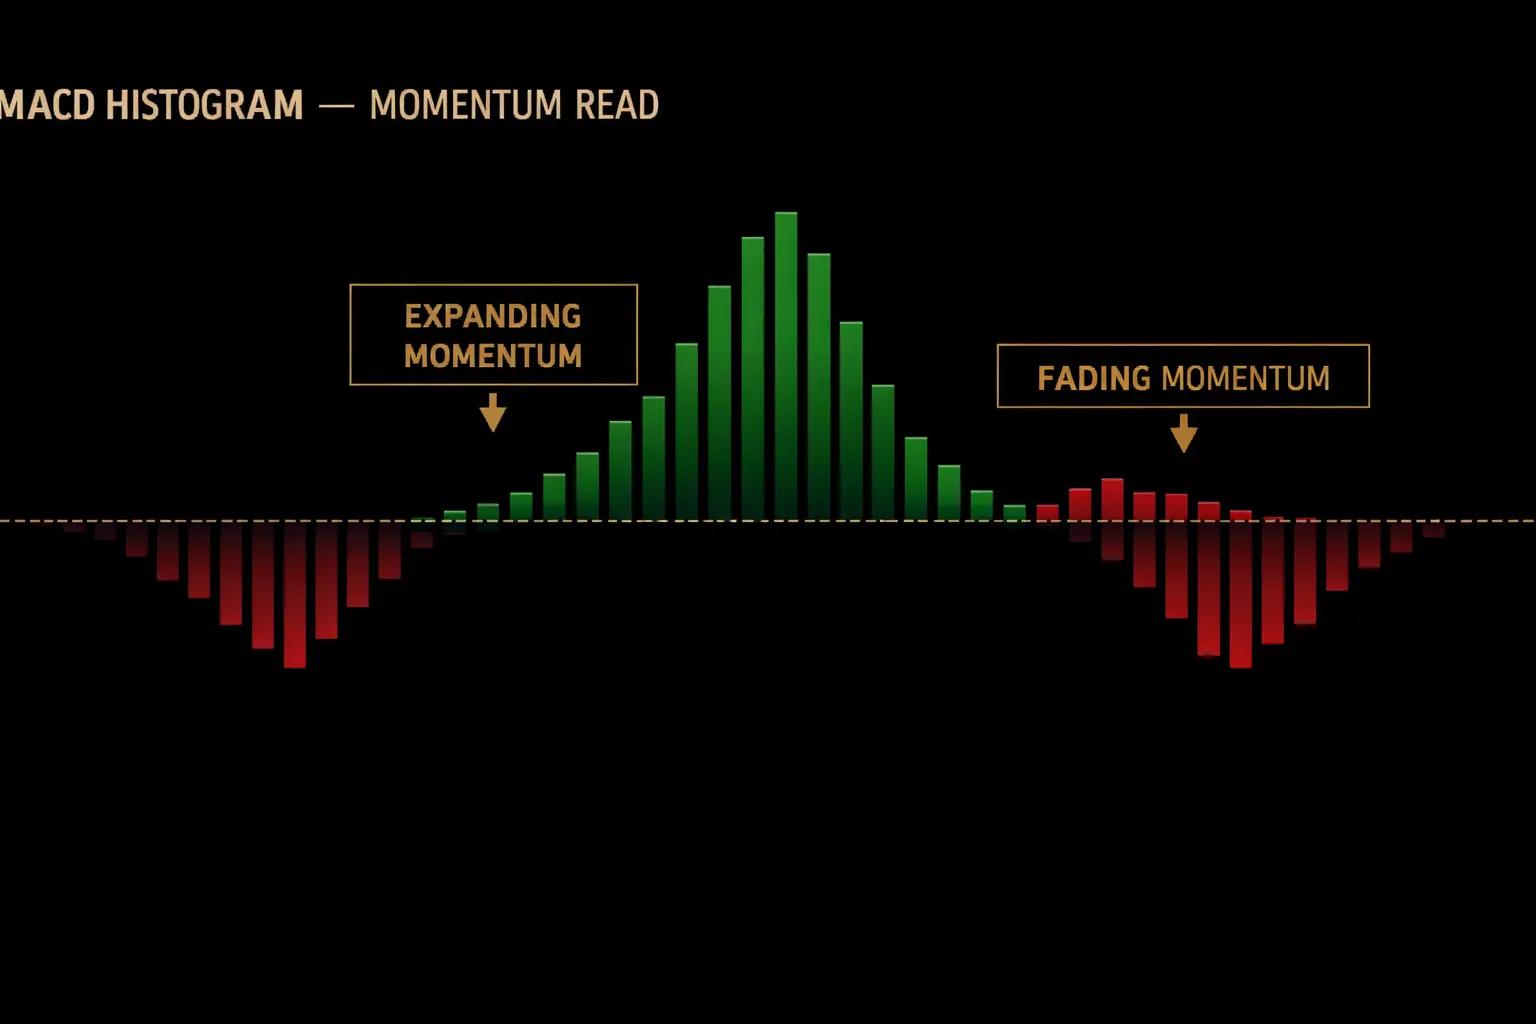
When histogram bars grow taller, momentum is expanding. When they shrink, momentum is fading — often before the MACD lines cross.
Practical histogram rules:
- Expanding positive bars = strong and accelerating bullish momentum — stay long.
- Contracting positive bars = bullish but weakening — trail your stop-loss higher.
- Contracting negative bars = selling is exhausting — watch for a bullish reversal setup.
- Expanding negative bars = acceleration to the downside — stay short or stay out.
In ranging markets where prices chop back and forth, histogram bars flip from positive to negative rapidly with little expansion in either direction. That is a clear signal: this is not a tradable environment for MACD. Wait for expansion before engaging.
MACD divergence — spotting reversals early
Just like RSI, MACD exhibits divergence — and MACD divergences often appear earlier and more reliably than RSI divergences in crypto markets.
Bearish MACD divergence: Price makes a higher high, but MACD makes a lower high. The new price peak was achieved with less momentum than the previous peak — the rally is running out of fuel. This frequently precedes significant reversals.
Bullish MACD divergence: Price makes a lower low, but MACD makes a higher low. Sellers are still pushing price down, but the downward momentum is fading. Bullish divergence has called some of the best crypto bottoms in recent years.
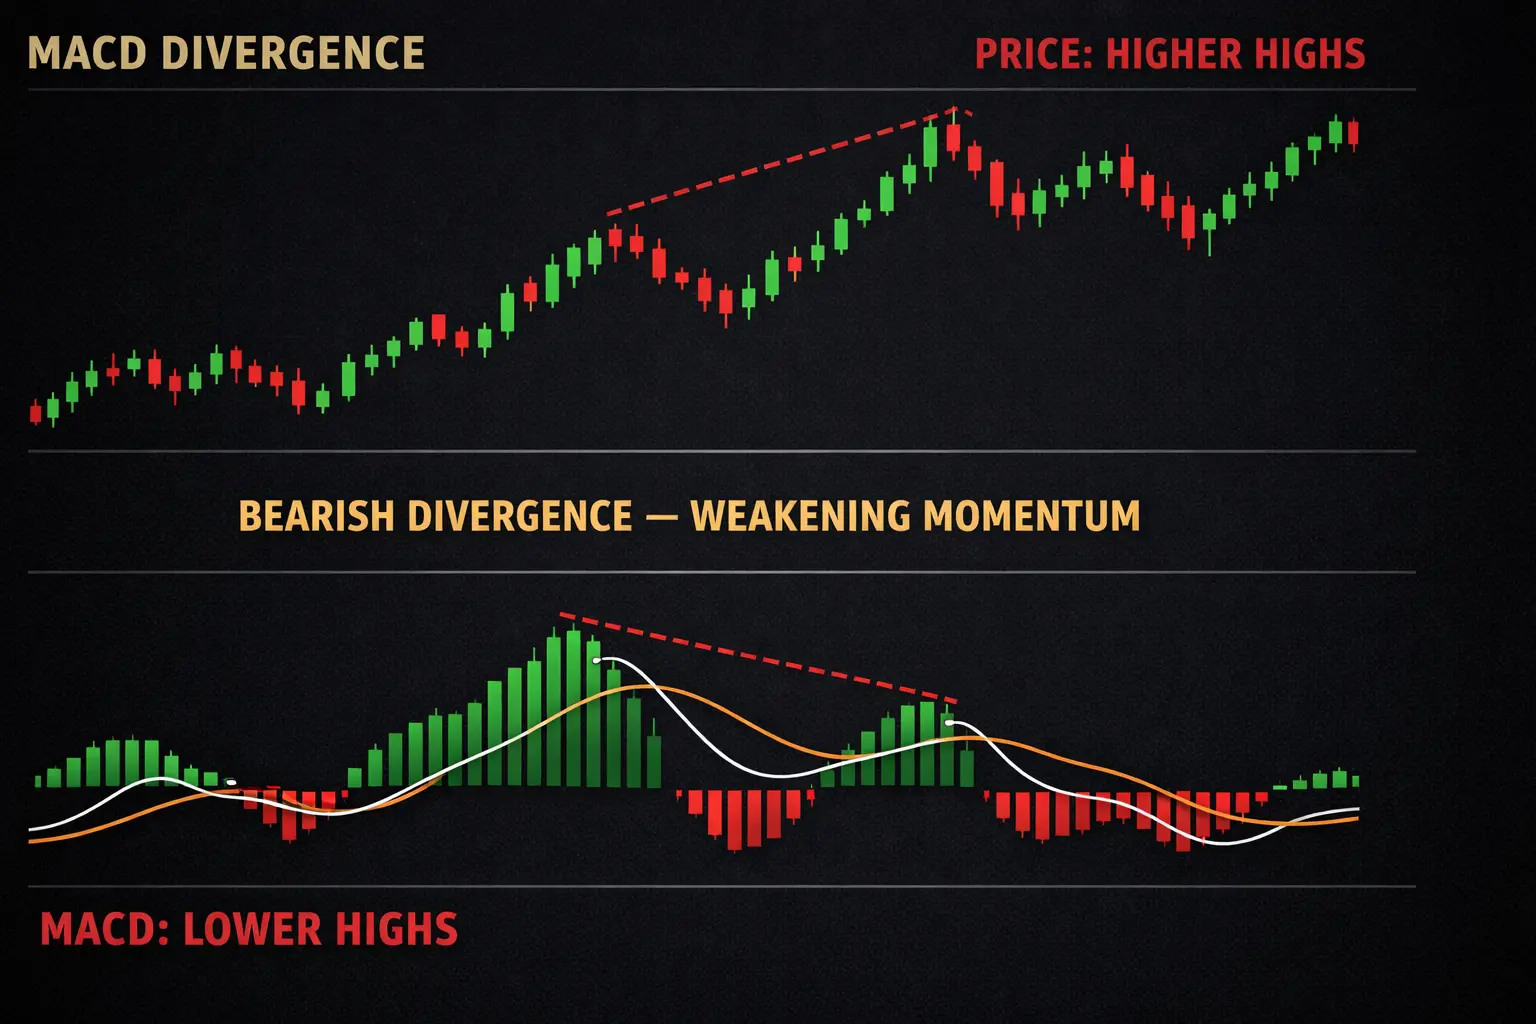
Classic bearish divergence: price makes new highs, but MACD visibly weakens — an early warning of trend exhaustion.
Trade divergences only on 4H and daily charts, and always wait for a structural confirmation — a clear close below the nearest swing low for bearish setups, or above the nearest swing high for bullish. Divergences that fail often fail quickly, so keep your stops tight.
Three complete MACD strategies with setups
Strategy 1 — The Zero-Line Crossover (trend-following)
The simplest and most robust MACD strategy focuses on zero-line crossovers rather than signal-line crossovers.
- On the daily chart of a major coin, wait for MACD line to cross above zero from below.
- Confirm the broader trend is constructive — price above the 50-day EMA is a good filter.
- Enter long on the close of the candle where the cross happens.
- Stop-loss below the nearest swing low (typically 3-5% on daily charts).
- Exit when MACD line crosses back below the signal line OR breaks below zero.
This strategy produces fewer signals than signal-line crossovers — maybe 3-5 per year per coin — but the ones it produces tend to catch significant moves. It is a patient person's strategy.
Strategy 2 — Signal Crossover + Histogram Confirmation
For swing traders who want more frequent opportunities, combine signal-line crossovers with histogram confirmation.
- On the 4H chart, wait for MACD line to cross above signal line.
- Confirm the histogram is GROWING (first bar is bigger than the previous bar).
- Enter long; stop-loss below the swing low just before the cross.
- Target the next major resistance OR exit on histogram contraction for three consecutive bars.
The histogram confirmation filter is the secret sauce here — it keeps you out of weak crossovers that immediately fail.
Strategy 3 — Divergence Reversal (advanced)
Highest win rate but requires the most patience. Detailed above in the divergence section. Scan the 4H and daily charts of your favourite pairs weekly. Real divergences appear 2-3 times per month across all major coins combined.
Five MACD mistakes that cost traders money
Mistake 1: Trading every crossover. In ranges, MACD whipsaws produce constant fake signals. Filter by trend, by zero line, or by histogram expansion.
Mistake 2: Using MACD on ultra-short timeframes. 1-minute and 5-minute MACD is nearly useless for anyone except experienced scalpers. Stick to 1H, 4H, and daily.
Mistake 3: Ignoring histogram contraction warnings. If your position is open and the histogram starts shrinking for three consecutive bars, that's a warning to tighten stops or take partial profits — even before any crossover.
Mistake 4: Using MACD as a standalone system. No single indicator works alone. MACD must be combined with trend analysis (price vs moving averages) and structure (support/resistance).
Mistake 5: Changing settings after every loss. Defaults of 12, 26, 9 have worked for 50 years. Random setting changes are emotional decisions that do not improve performance.
Combining MACD with other tools for confluence
The highest-probability trades happen when multiple independent signals align. Some combinations that work well:
- MACD + 50/200 EMA: Take MACD bullish crossovers only when price is above both EMAs. This keeps you in the direction of the larger trend.
- MACD + Support/Resistance: MACD crossovers at known S/R levels carry double weight. Combines momentum with structure.
- MACD + RSI: When MACD crosses bullish AND RSI comes out of oversold simultaneously, conviction is high. You'd have deeper context if you read our complete RSI trading strategy guide.
- MACD + Bollinger Bands: MACD crossover near a Bollinger Band touch produces strong mean-reversion setups.
MANTRI — Ask about MACD in real time
Inside CHAKRAVYUH, our A.I. copilot MANTRI can answer questions like "Is MACD bullish on ETH 4H right now?" or "Explain the current MACD setup on SOL" — pulling live data and giving you a strategy-aware answer rather than textbook theory. It's like having a trading mentor on call 24/7.
Explore Chakravyuh →Remember: MACD is a tool, not a prophecy. It provides context, not certainty. Used with discipline, risk management, and an understanding of market regime, it is one of the most reliable momentum tools in the trader's arsenal. Used as a magic-button crossover system, it bleeds capital slowly.
Frequently asked questions
What does MACD stand for and what does it measure?
MACD stands for Moving Average Convergence Divergence. It measures the relationship between two exponential moving averages of price — typically 12-period and 26-period EMAs. MACD helps traders spot momentum shifts and potential trend reversals by tracking when these averages pull apart or come together.
Is MACD better than RSI?
Neither is better — they measure different things. RSI measures how overbought or oversold an asset is. MACD measures the strength and direction of momentum. Many professional traders use both together: RSI for extremes, MACD for momentum confirmation. Beginners often start with RSI and add MACD as they grow.
What are the best MACD settings for crypto?
The default settings of 12, 26, 9 are most widely used and tested across decades. For crypto specifically, some scalpers use faster settings like 5, 13, 5 for more sensitivity. Swing traders may prefer slower settings like 19, 39, 9 to reduce noise. Start with the defaults and adjust only after you understand the standard behavior.
What is a MACD bullish crossover?
A bullish crossover occurs when the MACD line crosses above the signal line. This suggests momentum is shifting upward and often precedes price rallies. The strongest bullish crossovers happen below the zero line (oversold conditions) and move toward or above zero.
Can MACD predict crypto trend reversals?
MACD can signal potential reversals through divergences and zero-line crossovers, but no indicator predicts with certainty. A MACD divergence — when price and MACD move in opposite directions — is one of the earliest warning signs of a weakening trend. Always confirm with price action before acting.
cRyPtO sMaRt is not registered with SEBI and does not provide investment advice. Crypto trading carries significant risk of capital loss. The strategies, examples, and opinions shared in this article are for educational purposes only. Always do your own research and consult a SEBI-registered financial advisor before investing real capital. Past performance does not guarantee future results.