
- The Fibonacci sequence and why it matters in markets
- The key retracement levels explained
- How to draw Fibonacci retracement correctly
- The golden pocket — 61.8% to 78.6%
- Fibonacci extensions — setting profit targets
- Complete Fibonacci trading strategies
- Fibonacci mistakes that cost traders
- Combining Fibonacci with other tools
- Frequently asked questions
The Fibonacci sequence and why it matters in markets
Before we dive into the trading application, let's understand where Fibonacci retracement comes from. In the 13th century, Italian mathematician Leonardo Fibonacci introduced a sequence of numbers — 0, 1, 1, 2, 3, 5, 8, 13, 21, 34, 55, 89... — where each number is the sum of the two before it. What fascinated mathematicians and, eventually, traders, is that the ratios between these numbers converge to a specific value: 0.618. This is known as the "golden ratio" and appears throughout nature — from the spirals of galaxies to the arrangement of leaves on a plant.
Fast forward to modern markets, and traders have found that price movements often respect Fibonacci ratios during pullbacks. Whether this is because of deep mathematical order in markets, or simply because millions of traders now watch these levels (creating a self-fulfilling prophecy), the end result is the same: Fibonacci retracement levels work as practical reference points for entries, exits, and stops.
For Indian crypto traders, Fibonacci tools are especially useful because crypto markets don't respect traditional support and resistance as cleanly as stocks do — there are no company earnings, no board decisions, no quarterly reports anchoring price. Fibonacci levels give you a framework for where pullbacks might end when there's no fundamental anchor in sight.
The key retracement levels explained
Fibonacci retracement levels are drawn as horizontal lines between a swing low and swing high. The primary levels are:
23.6% — The Shallow Retrace. The smallest pullback level. Typically seen in very strong trends where buyers (or sellers) barely give up any ground before pushing again. Trades at 23.6% work best when combined with immediate momentum confirmation — RSI coming off an extreme, or a strong reversal candle.
38.2% — The First Meaningful Pullback. A common first-stop for pullbacks in healthy trends. If price holds 38.2% and bounces, the trend is strong. If it breaks through, expect a deeper retracement to 50% or 61.8%.
50% — The Psychological Level. Technically, 50% is not a Fibonacci ratio — but it's included in every Fib tool because 50% retracements are psychologically significant. Half a move is a fair pullback. Many traders set alerts and watch this level closely.
61.8% — The Golden Ratio. This is the most watched level in all of technical analysis. Derived directly from the Fibonacci sequence, 61.8% pullbacks often mark the deepest retracement in healthy trends. A successful bounce from 61.8% is one of the highest-probability reversal signals that exists.
78.6% — The Final Defense. When price retraces to 78.6%, the original trend is on its last legs. If 78.6% holds and price reverses strongly, it's often the last chance to enter the trend before it resumes. If 78.6% breaks, the trend is likely over and a new direction is emerging.
How to draw Fibonacci retracement correctly
Drawing Fibs correctly is where most beginners struggle. The key rule: draw in the direction of the primary trend.
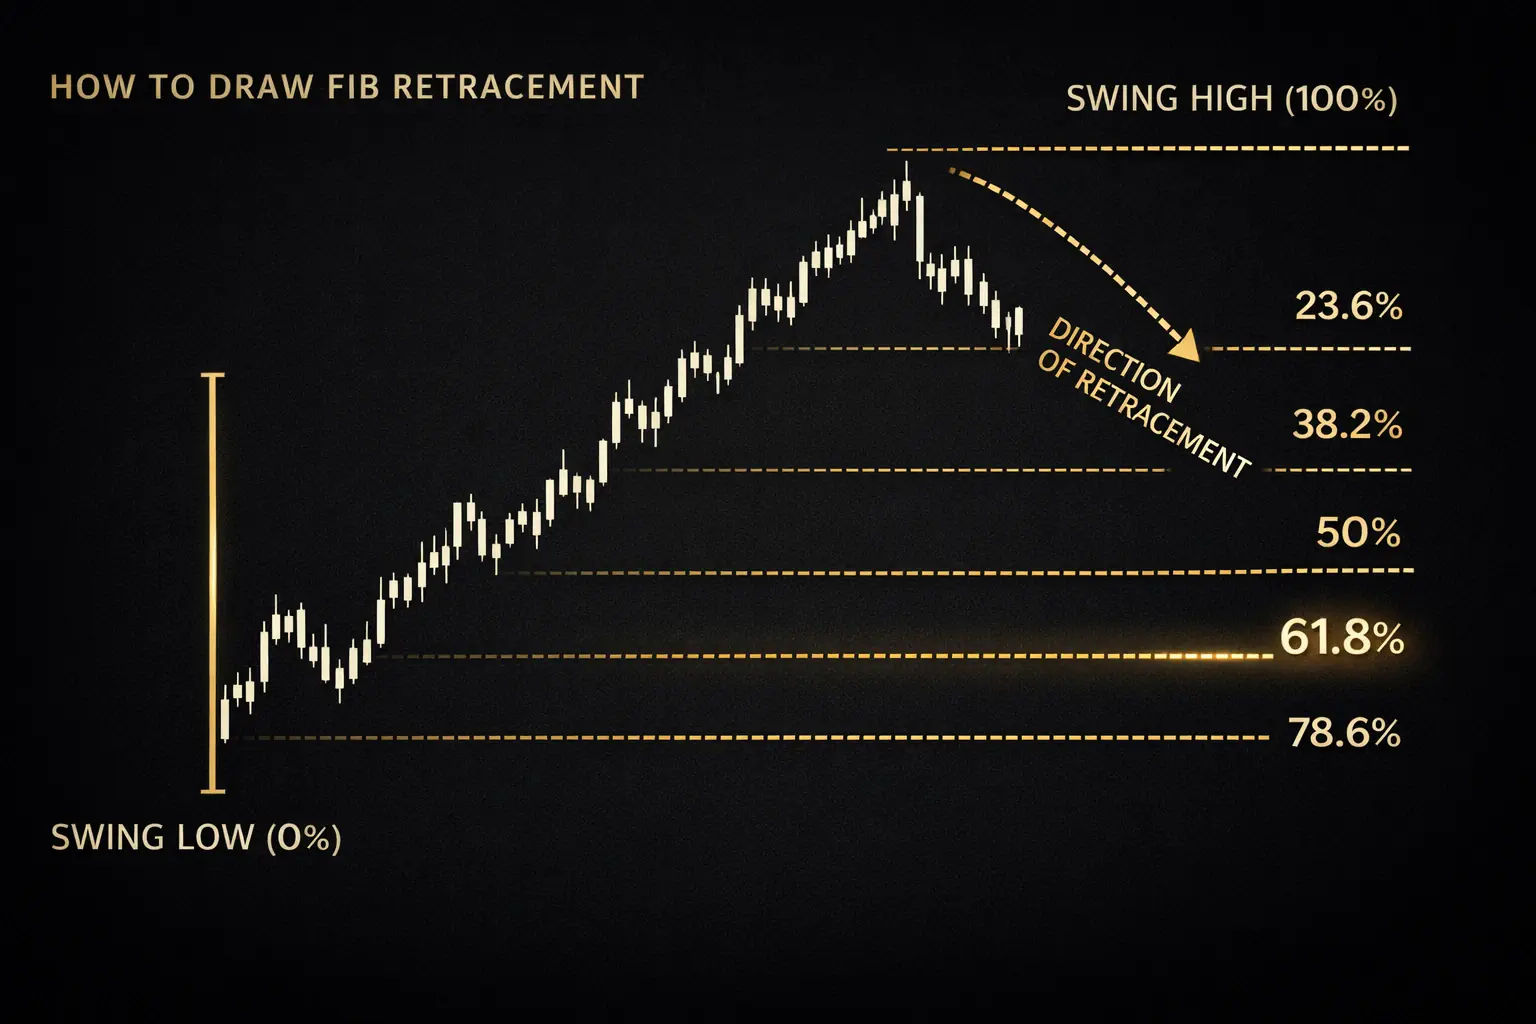
In an uptrend, draw from the recent swing low (0%) to the recent swing high (100%). The retracement levels fill in automatically.
For an uptrend: Draw from the recent swing LOW (0% level) to the recent swing HIGH (100% level). Retracement levels appear between them. Price is expected to pull back to one of these levels before potentially resuming higher.
For a downtrend: Draw from the recent swing HIGH (0% level) to the recent swing LOW (100% level). Retracement levels appear between them. Price is expected to bounce up to one of these levels before potentially resuming lower.
Which swings to use: This is where art meets science. The best Fibs are drawn between significant swings — ones that are clearly visible on the chart even from a distance. Don't draw between every tiny wiggle. Use the most recent major move. For daily traders, that means daily-chart swings. For 4H traders, 4H swings. Matching your Fib timeframe to your trading timeframe is critical.
Reset your Fibs regularly: When price makes a new swing high (or low), your old Fib may no longer be relevant. Redraw based on the new structure. Fibs drawn weeks ago on old swings rarely work reliably.
The golden pocket — 61.8% to 78.6%
Professional traders talk about the "golden pocket" — the zone between 61.8% and 78.6% retracement. This is where the highest-probability reversal setups live.
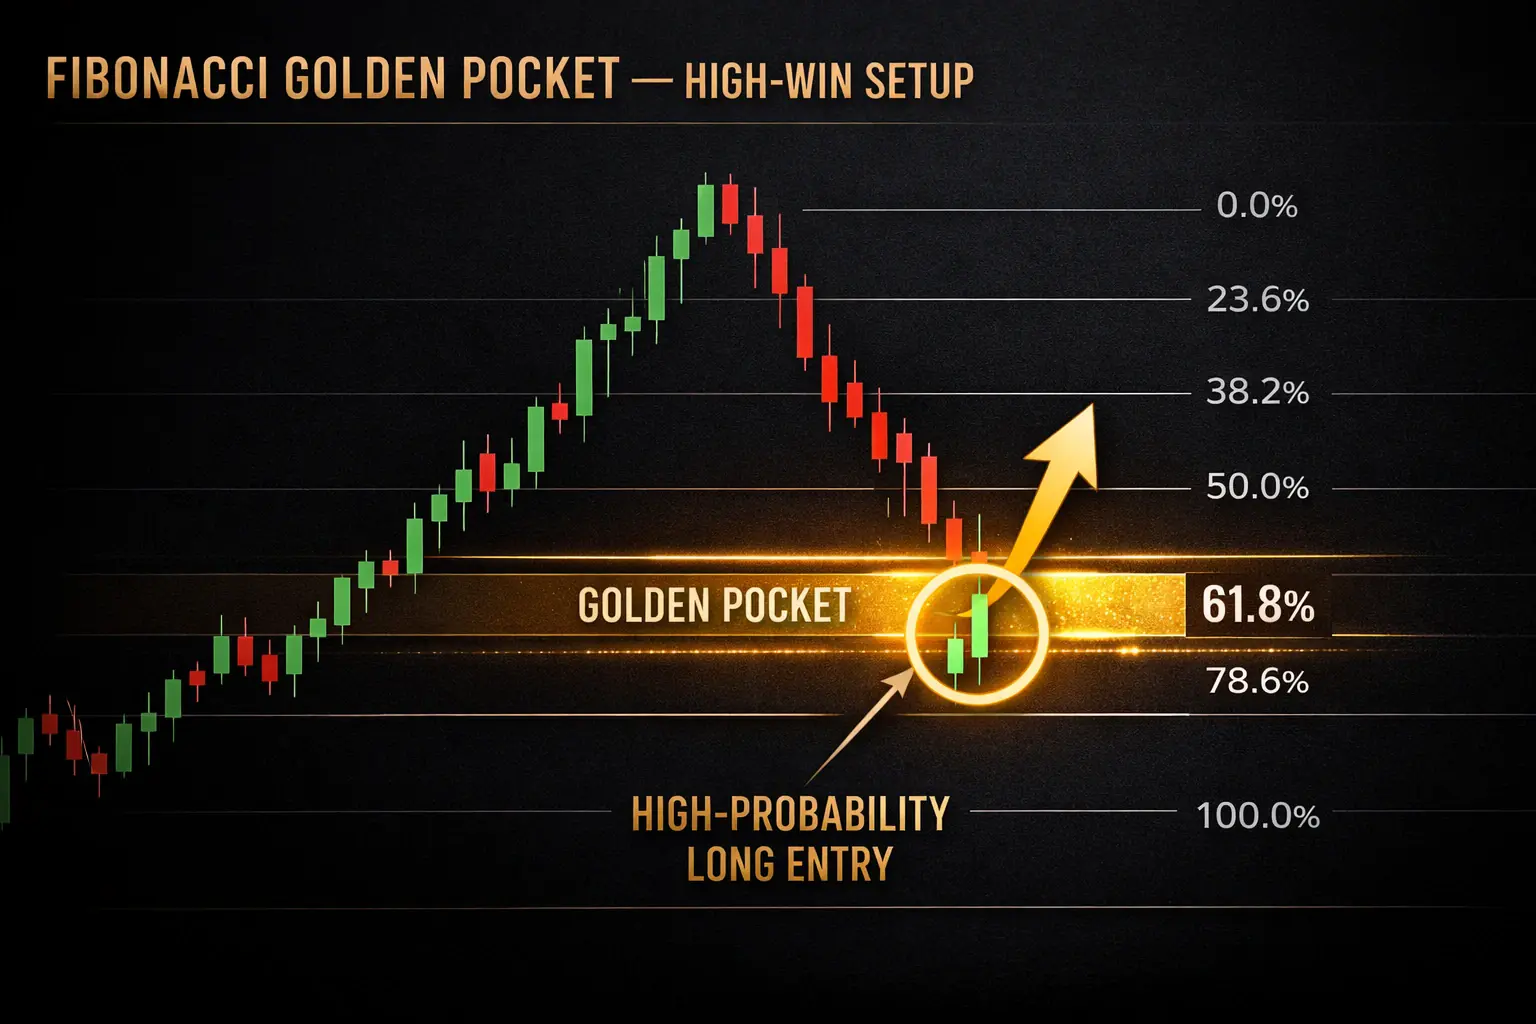
The golden pocket: a high-probability reversal zone where trend traders look for bounces.
Why the golden pocket? Because a pullback to this depth is deep enough to shake out weak hands, retest support, and reset momentum — but not so deep that it invalidates the larger trend. In strong trends, this is where "smart money" often adds to positions.
Golden pocket entry rules:
- Confirm the primary trend is intact on the higher timeframe (daily or 4H).
- Wait for price to enter the 61.8% to 78.6% zone.
- Look for confirmation: a strong bullish reversal candle (hammer, engulfing pattern), RSI bouncing from oversold, volume returning.
- Enter on the close of the confirmation candle.
- Stop-loss just below 78.6% (or below the swing low if price pokes lower).
- Take-profit: previous swing high, or use extensions (next section).
Real-world context: Bitcoin's 2025 recovery from its autumn correction saw price retrace to the 61.8% of its prior rally before bouncing — the same pattern that has repeated across countless crypto cycles.
Fibonacci extensions — setting profit targets
While retracements measure pullbacks within a trend, extensions project targets beyond the previous swing high or low. This is where Fibonacci really earns its keep for exits.
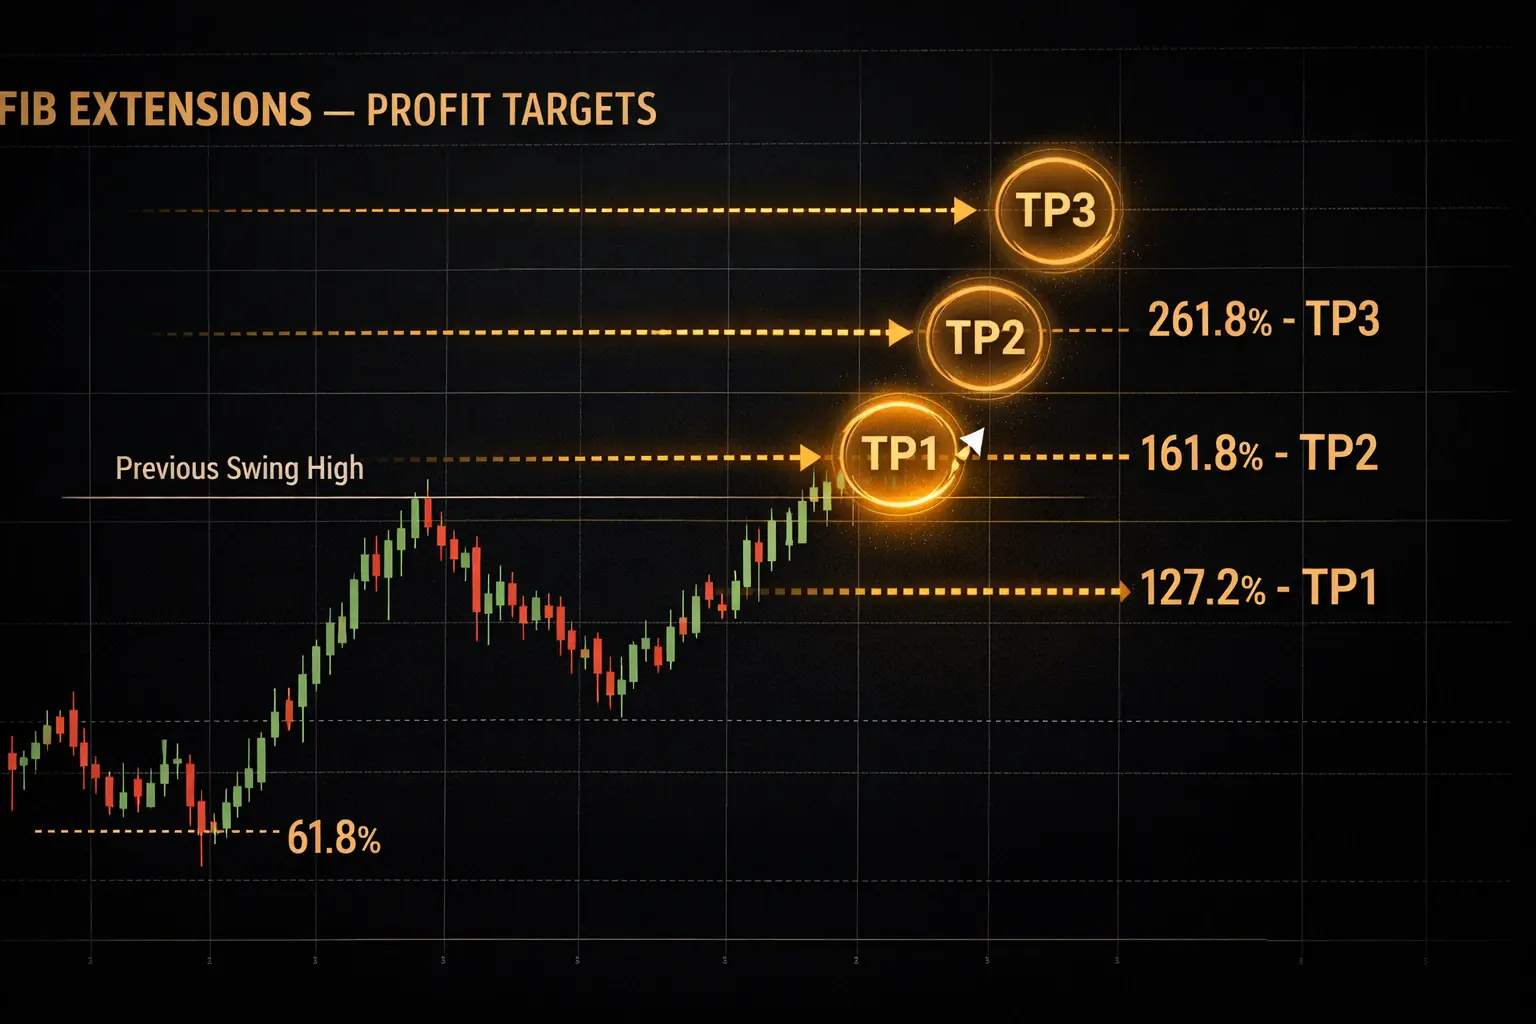
Extensions project beyond the previous high — 127.2%, 161.8%, and 261.8% are the classic targets.
The most used extension levels are:
- 127.2% — the nearest target, often hit even in modest trend continuations.
- 161.8% — the "golden extension", one of the most common targets in strong moves.
- 261.8% — reached only in the strongest trends, often marking a local top.
Using extensions for exits:
- After entering a trend-continuation trade (for example, a golden-pocket bounce), draw extensions based on the original swing.
- Set partial take-profit at 127.2%.
- Set second partial at 161.8%.
- Trail the remainder or target 261.8% for a runner.
Extensions give you structured exit points instead of guessing. This alone can dramatically improve the risk-to-reward of any strategy.
Complete Fibonacci trading strategies
Strategy 1 — The Golden Pocket Bounce (best for trend traders)
Full details above. This is the signature Fibonacci setup and the highest-probability trade using Fibs alone.
Best markets: liquid altcoins in strong trends (ETH, SOL, BNB during bull phases).
Frequency: 2-4 setups per major pair per month during trending phases. Zero setups during choppy phases.
Strategy 2 — 50/61.8 Confluence with Moving Average
When the 50% or 61.8% Fib level coincides with a major moving average (50 EMA or 200 EMA), the level becomes doubly significant.
- Draw Fib retracement on the daily chart for a recent major move.
- Check: does the 50% or 61.8% Fib align with a rising 50 or 200 EMA?
- If yes, watch for price to reach that zone with reversal confirmation.
- Enter, stop below the level, target previous swing high + Fib extensions.
Strategy 3 — Fib + Trendline Break (reversal setup)
For catching trend reversals rather than continuations. When an established trend breaks its trendline AND retraces into a Fib zone (typically 38.2%), it often signals a genuine reversal.
For more on spotting reversals early, see our guide on top 5 chart patterns every trader must know.
Fibonacci mistakes that cost traders
Mistake 1: Drawing Fibs on trivial swings. Tiny 5-minute swings don't produce meaningful Fibs. Use significant higher-timeframe swings.
Mistake 2: Trading Fibs without trend context. A 61.8% retracement in an uptrend is a buy signal. A 61.8% retracement during a downtrend reversal attempt is a short signal. Direction matters.
Mistake 3: Using only one Fib level as a hard entry. Price rarely turns exactly at 61.8%. Think in zones, not lines. The 61.8-78.6% "golden pocket" concept exists for a reason.
Mistake 4: Forgetting to confirm. Don't enter just because price touches a Fib level. Wait for a reversal candle, volume, or momentum confirmation.
Mistake 5: Not updating Fibs. Old Fibs drawn from outdated swings mislead. Redraw when new swings form.
Combining Fibonacci with other tools
Fibonacci levels become much more powerful with confluence:
- + Moving Averages: When Fib levels coincide with major EMAs, expect stronger reactions.
- + Horizontal Support/Resistance: A Fib level AT a prior support zone is a double-strength level.
- + RSI: A golden pocket touch with RSI in oversold territory is an institutional-grade setup. See our complete RSI guide.
- + Volume Profile: Fib levels near high-volume nodes in volume profile analysis are particularly reliable.
YANTRA NETRA — Let A.I. find confluence setups
Drawing Fibs manually on dozens of altcoins is tedious. YANTRA NETRA, the A.I. pattern scanner inside CHAKRAVYUH, detects price-action structures and support/resistance clusters automatically — often revealing Fib-confluence setups you might have missed on your manual scan. Combine that with DRISHTIKON signals and you have a powerful edge.
Explore Chakravyuh →Fibonacci retracement is not about predicting exact turning points — no tool can do that. It's about having a structured framework for where pullbacks might end, where reversals might start, and where profit targets make sense. Used with discipline and confluence, it remains one of the most widely respected tools in all of technical analysis, for good reason.
Frequently asked questions
What is Fibonacci retracement and does it really work in crypto?
Fibonacci retracement is a tool that marks horizontal levels at key percentages (23.6%, 38.2%, 50%, 61.8%, 78.6%) between a swing high and swing low. In crypto, these levels often act as support and resistance because thousands of traders watch them, creating a self-fulfilling prophecy. They're not magical, but they are reliable reference points.
What is the Fibonacci golden pocket?
The 'golden pocket' is the zone between the 61.8% and 78.6% retracement levels. It's the deepest pullback zone that often provides the highest-probability reversal opportunities in strong trends. When price reaches this zone and shows rejection, many professional traders consider it a prime entry area.
How do I correctly draw Fibonacci retracement?
In an uptrend, draw from the recent swing low to the swing high. In a downtrend, draw from swing high to swing low. Use visible significant swings — typically ones that stand out clearly on the chart. Higher timeframe swings (daily, 4H) produce more reliable Fib levels than tiny 5-minute swings.
Can I use Fibonacci as my only trading indicator?
You can, but you probably shouldn't. Fibonacci works best combined with trend context, support/resistance, and candlestick confirmation. Used alone, Fib levels produce many false signals. Used with confluence from other tools, they become highly effective entry and target zones.
What are Fibonacci extensions used for?
While retracements measure pullbacks within a trend, extensions project potential targets beyond the previous swing high or low. Common extension levels are 127.2%, 161.8%, and 261.8%. Traders use them to plan profit targets when a trend continues after a pullback.
cRyPtO sMaRt is not registered with SEBI and does not provide investment advice. Crypto trading carries significant risk of capital loss. The strategies, examples, and opinions shared in this article are for educational purposes only. Always do your own research and consult a SEBI-registered financial advisor before investing real capital. Past performance does not guarantee future results.