
- What is volume profile?
- The Point of Control (POC) — price's magnet
- The Value Area — where 70% of trades happened
- High-volume vs low-volume nodes
- Complete volume profile strategies
- How institutional traders use volume profile
- Volume profile mistakes to avoid
- Combining volume profile with other tools
- Frequently asked questions
What is volume profile?
If you've ever looked at a crypto chart and wondered "where do big players really have their positions?", volume profile is the tool that answers that question. It transforms the chart from a simple record of price over time into a map of where actual money changed hands.
Most traders are familiar with traditional volume — those vertical bars beneath the price chart showing how much was traded during each candle. Traditional volume is useful, but it has a major limitation: it tells you when volume happened, not where (at what price) it happened.
Volume profile flips this around. Instead of showing volume per time bar, it shows volume per price level. The result is a horizontal histogram of bars, each representing how much was traded at that specific price. Large bars mark prices where heavy trading occurred. Small bars mark prices where few trades happened.
This matters because markets have memory. Prices where large volume was traded become natural support and resistance zones — people who bought there defend their positions, people who were trapped defend against getting stopped, and bots built around those levels trigger orders. Prices with very low volume are "vacuums" — air pockets where price tends to move fast because there's nothing to stop it.
Volume profile was originally developed for the Chicago futures markets and used by institutional traders for decades before retail traders got easy access. Now, every major crypto charting platform includes it. Understanding how to read it is a genuine edge because many retail traders still don't use it — or use it incorrectly.
The Point of Control (POC) — price's magnet
The most important feature on any volume profile is the Point of Control, or POC. This is the single price level that had the highest volume over the selected period. Visually, it's the longest horizontal bar.
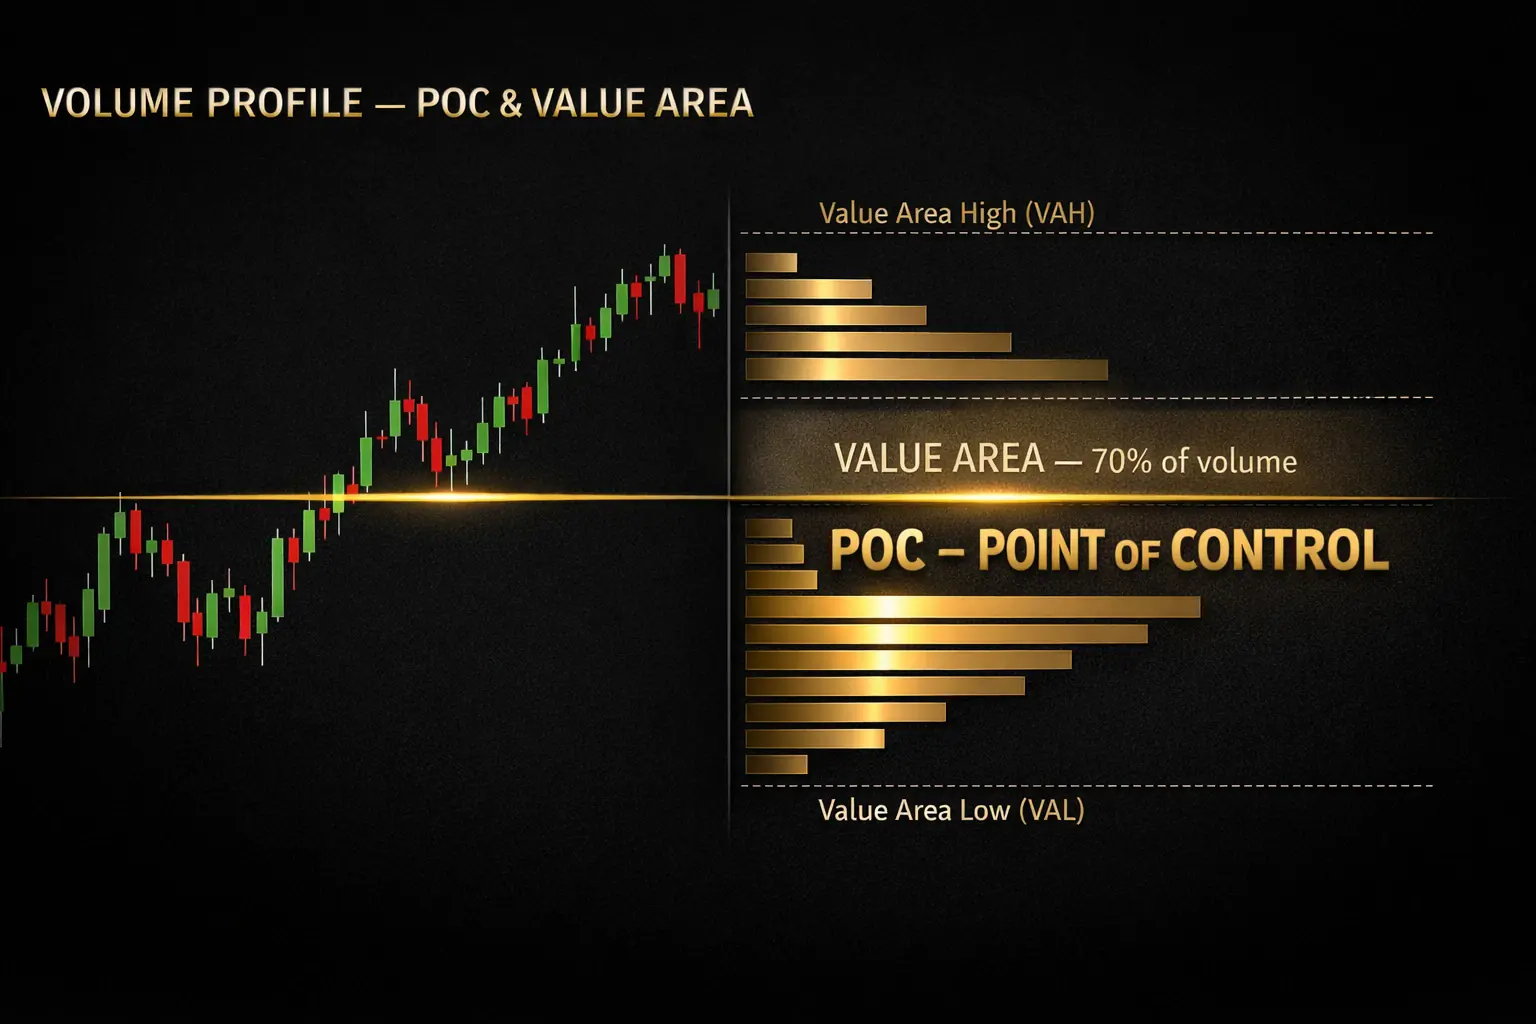
The Point of Control (POC) is the price level where the most volume traded. It acts as a strong magnet for future price action.
Why does POC matter so much? Because it represents fair value as agreed upon by the market. Thousands of traders traded at that price. When price moves away from POC (in either direction), it tends to feel "imbalanced" — and markets have a strong tendency to return to POC levels over time.
Trading with POC:
- POC as magnet: When price moves far from POC, expect eventual retracement toward it.
- POC as support/resistance: When price approaches POC from above, it often acts as support. From below, as resistance.
- POC shift: When POC moves higher over time (e.g. daily), buyers are aggressively absorbing supply. When POC shifts lower, sellers dominate.
One practical approach: set price alerts at the POC of the current week on your main pairs. When price reaches POC, you know a significant decision point has arrived — either a bounce or a break through.
The Value Area — where 70% of trades happened
The second critical concept is the Value Area — the price range where 70% of the total volume was traded. It's bounded by:
- Value Area High (VAH): The upper edge of the 70% volume zone.
- Value Area Low (VAL): The lower edge of the 70% volume zone.
Why 70%? It's a statistical convention borrowed from market profile analysis — one standard deviation above and below the mean under normal distribution. In practice, it captures what most traders consider "normal" price behavior for the given period.
Trading the Value Area:
- Inside value area: Market is balanced, expect ranging or sideways behavior. Mean-reversion strategies work.
- Breakout above VAH with volume: Bullish — market is moving to a new value area. Consider trend-following entries.
- Breakout below VAL with volume: Bearish — bears are establishing lower value. Consider shorts.
- Rejection at VAH/VAL: Market respecting value boundaries. Enter fades back toward POC.
High-volume vs low-volume nodes
Zoom out and look at the entire volume profile. You'll see varying bar lengths creating a distinctive shape with clear "peaks" and "valleys". These peaks and valleys have names:
High-Volume Nodes (HVN): Zones where volume piled up — acceptance, consolidation, or heavy position-building. These zones act as strong support and resistance because many traders have positions there. When price returns to an HVN, expect slower price action, indecision, or reversal.
Low-Volume Nodes (LVN): Zones where very little volume traded — rejection or rapid price travel. These zones are "vacuums". When price enters an LVN, expect fast movement through, because there's no positioning to defend the level.
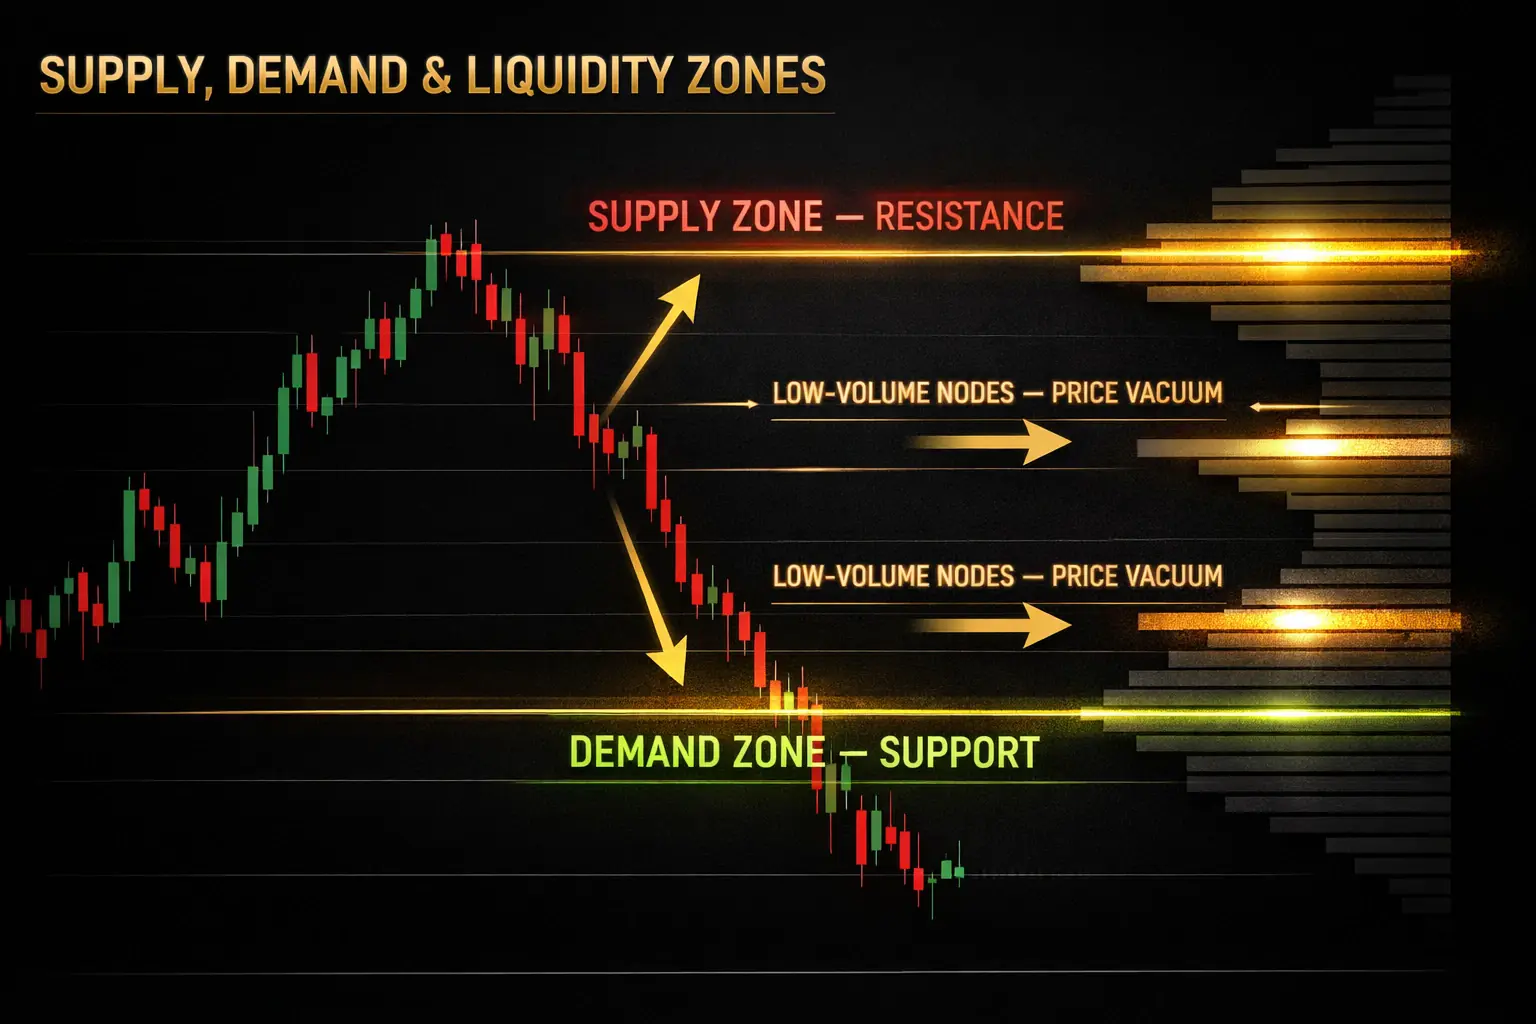
High-volume nodes become support/resistance zones. Low-volume nodes become price vacuums where price accelerates through.
Practical interpretation:
- HVN above current price → expect resistance when approached.
- HVN below current price → expect support when tested.
- LVN between current price and an HVN → expect rapid price travel through the LVN.
- When price breaks an HVN with conviction and volume, the level often flips role (support becomes resistance or vice versa).
Complete volume profile strategies
Strategy 1 — The Value Area Reversion (range trading)
When price exits the Value Area but fails to establish momentum, expect a return to POC.
- Identify the current day's or week's POC and Value Area.
- Wait for price to trade outside Value Area (above VAH or below VAL).
- Look for weak follow-through — small candles, volume drying up, RSI not confirming.
- Enter fade back toward POC: short at VAH, long at VAL.
- Stop 0.5-1% beyond the Value Area edge.
- Target POC for first exit, opposite Value Area edge for full exit.
Strategy 2 — The LVN Breakout (momentum)
When price breaks into a low-volume node, it often moves fast through it until hitting the next high-volume zone.
- Identify clear LVN zones on the profile.
- Wait for price to break into an LVN with confirming volume.
- Enter in the direction of the break.
- Stop-loss on the opposite side of the LVN.
- Target: the next HVN in the direction of travel.
Strategy 3 — The Volume-Confirmed Breakout
When price breaks a key level (POC, VAH, VAL, or HVN), volume confirmation separates real breakouts from fakeouts.
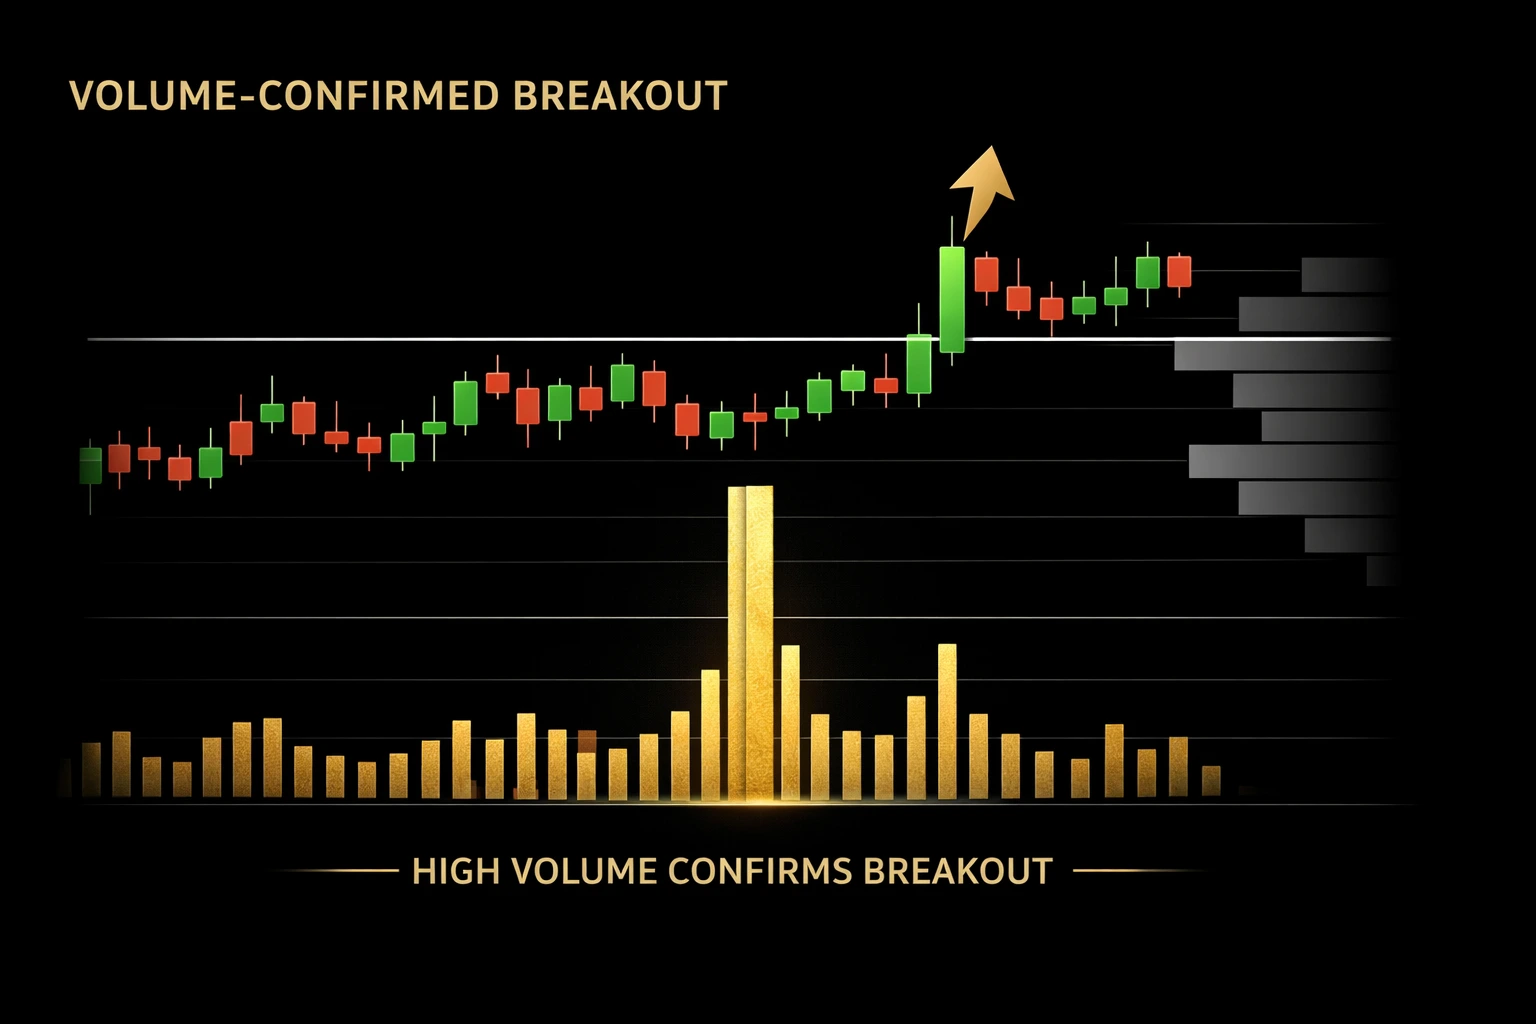
A genuine breakout above a volume-profile resistance zone should come with a clear volume spike.
- Identify resistance at a POC or HVN above current price.
- Wait for price to approach and break through.
- Required: volume on the break is at least 1.5-2x the recent average.
- Enter on the close of the breakout candle.
- Stop-loss back inside the broken zone.
- Target: next HVN or use extensions from Fibonacci analysis.
How institutional traders use volume profile
Professional and institutional traders use volume profile in ways most retail traders don't:
Multi-timeframe profiles: Institutions watch daily, weekly, and monthly volume profiles simultaneously. A price that's at the weekly POC but breaking the daily POC tells a different story than one breaking both simultaneously.
Session volume profile: For intraday traders, dividing volume by trading session (Asian, European, US) reveals which session is controlling price action. This is especially useful in crypto where sessions still have distinct character despite 24/7 trading.
Volume profile + market structure: Where HVNs align with market structure points (swing highs, swing lows, structural levels), the confluence creates institutional-grade setups. This is the edge smart money extracts from the tool.
Anchored volume profile: Profile drawn from a specific significant event — a major breakout, a news event, a cycle low — shows where volume settled after that specific moment. This reveals whether the post-event positioning supports continuation or signals exhaustion.
Volume profile mistakes to avoid
Mistake 1: Using profile without context. Profile without trend analysis produces noise. Always check if the broader market is trending or ranging first.
Mistake 2: Wrong lookback period. Using a 5-year profile for intraday trading is useless. Match the profile period to your trading horizon: weekly profile for swing trades, daily for intraday.
Mistake 3: Expecting exact prices. POC and VAH/VAL are zones, not laser-precise lines. Price often reacts within a small range near these levels.
Mistake 4: Treating profile as prediction. Profile shows where volume HAS been, not where price WILL go. It's a context tool, not a crystal ball.
Mistake 5: Ignoring volume on the break. Without volume confirmation, most breakouts fail. Combining profile levels with breakout volume is the basic filter for quality.
Combining volume profile with other tools
Volume profile reaches its full power when combined with complementary tools:
- + Market Structure: HVNs at swing points create ultra-strong zones.
- + Moving Averages: POC aligned with a major EMA is worth double attention.
- + RSI: Oversold RSI at a high-volume support zone is a classic institutional entry. See our RSI guide.
- + Order Blocks & FVGs: Smart money concepts pair naturally with volume profile — the zones often align.
- + Fibonacci: Fib levels that coincide with HVNs are particularly strong. See our Fibonacci guide.
NETRA — Institutional-grade volume profile built-in
Volume profile is one of the six smart-money concepts analyzed by NETRA — the 3D Smart Money X-Ray tool at cRyPtO sMaRt. NETRA draws volume profile automatically alongside order blocks, liquidity pools, fair value gaps, and market structure, and highlights only the zones where multiple factors align. It's what institutional traders see, finally accessible to Indian retail traders.
Explore NETRA →Volume profile takes time to master — maybe 30-60 days of deliberate practice and journaling. But once it clicks, you see the market differently. Instead of watching random price movements, you see where positions sit, where pressure builds, and where price is likely to attract or repel. That shift in perception is what separates amateur chart-watchers from professionals. Combined with good risk management and patient setup selection, volume profile is genuinely one of the most powerful tools in modern trading.
Frequently asked questions
What is volume profile and how is it different from regular volume?
Regular volume shows how much was traded over time (bars below the chart). Volume profile shows how much was traded at each price level (horizontal bars on the side). Volume profile answers 'where were people trading?' while regular volume answers 'when were people trading?' — both are useful, but volume profile is more strategic.
What is the Point of Control (POC)?
The Point of Control is the single price level where the most volume was traded in a given period. Visually, it's the longest horizontal bar on the volume profile. POC acts as a strong magnet for price — price tends to return to POC levels repeatedly because that's where most market participants agreed on value.
What is the Value Area in volume profile?
The Value Area is the price range where 70% of the total volume was traded. It's bounded by the Value Area High (VAH) on top and Value Area Low (VAL) on the bottom. When price is inside the Value Area, the market is in 'fair value' territory. Moves outside this range often present trading opportunities.
How do I use volume profile to find support and resistance?
Long horizontal bars (high-volume nodes) mark zones where lots of trading occurred — these act as support or resistance because many positions are defended there. Short horizontal bars (low-volume nodes) are price vacuums where price tends to move quickly through. Trade setups are built around these zones.
Is volume profile good for day trading crypto?
Yes — day traders often use session volume profile (profile for a single trading session) to identify intraday levels where smart money accumulated or distributed positions. Combined with support/resistance and trend, volume profile is one of the most powerful intraday tools available.
cRyPtO sMaRt is not registered with SEBI and does not provide investment advice. Crypto trading carries significant risk of capital loss. The strategies, examples, and opinions shared in this article are for educational purposes only. Always do your own research and consult a SEBI-registered financial advisor before investing real capital. Past performance does not guarantee future results.