- What are Bollinger Bands?
- How the three bands work together
- The Bollinger squeeze — calm before the storm
- The band walk — trend rider's friend
- Mean reversion with Bollinger Bands
- Three complete Bollinger strategies
- Common Bollinger Band mistakes
- Combining Bollinger Bands with other tools
- Frequently asked questions
What are Bollinger Bands?
Bollinger Bands are a volatility-based indicator created by John Bollinger in the early 1980s. Unlike RSI or MACD which sit in a separate panel, Bollinger Bands are drawn directly on the price chart — three lines that envelope price action and expand or contract based on how volatile the market is.
For crypto traders, Bollinger Bands offer something unique: a visual representation of volatility itself. You don't need to calculate anything or read numbers. If the bands are narrow, volatility is low. If they are wide, volatility is high. If price hugs the upper band, buyers are in firm control. If price hugs the lower band, sellers dominate. The information is visual and immediate.
In volatile Indian crypto markets — where prices can move 8-10% in a day on altcoins — Bollinger Bands help you separate "normal" moves from extraordinary ones. A price touching the upper band in calm conditions is different from one touching the upper band during a volatility expansion. The indicator teaches you to think about market context, not just price levels.
How the three bands work together
Bollinger Bands consist of three lines:
Middle Band: A 20-period simple moving average (SMA). This is the center of gravity — where price tends to return during normal conditions. Often drawn as a dashed line in charts.
Upper Band: The middle band plus 2 standard deviations of price. Statistically, about 95% of price action should stay below this line.
Lower Band: The middle band minus 2 standard deviations. About 95% of price action should stay above this line.
The space between upper and lower bands represents the "normal" volatility range. When price moves outside these bands — even briefly — it's a statistically rare event that deserves attention.
Why 2 standard deviations? Standard deviation is a measure of how much prices typically vary from their average. Setting the bands at 2 standard deviations captures roughly 95% of price movements under normal market conditions. This is why band touches are noteworthy — they represent the outer edge of normal behavior.
The bands automatically adjust to current volatility. In quiet periods, they contract toward the middle band. In volatile periods, they expand away. This auto-adjustment is what makes Bollinger Bands so useful — you don't need to change settings based on market conditions.
The Bollinger squeeze — calm before the storm
One of the most reliable patterns in all of technical analysis is the Bollinger squeeze: a period of unusually narrow bands followed by explosive volatility expansion.
The logic is simple. Markets oscillate between low-volatility consolidation and high-volatility expansion. When bands contract to their tightest range in recent history, a breakout is statistically likely to follow — and when volatility expands, it often does so dramatically.
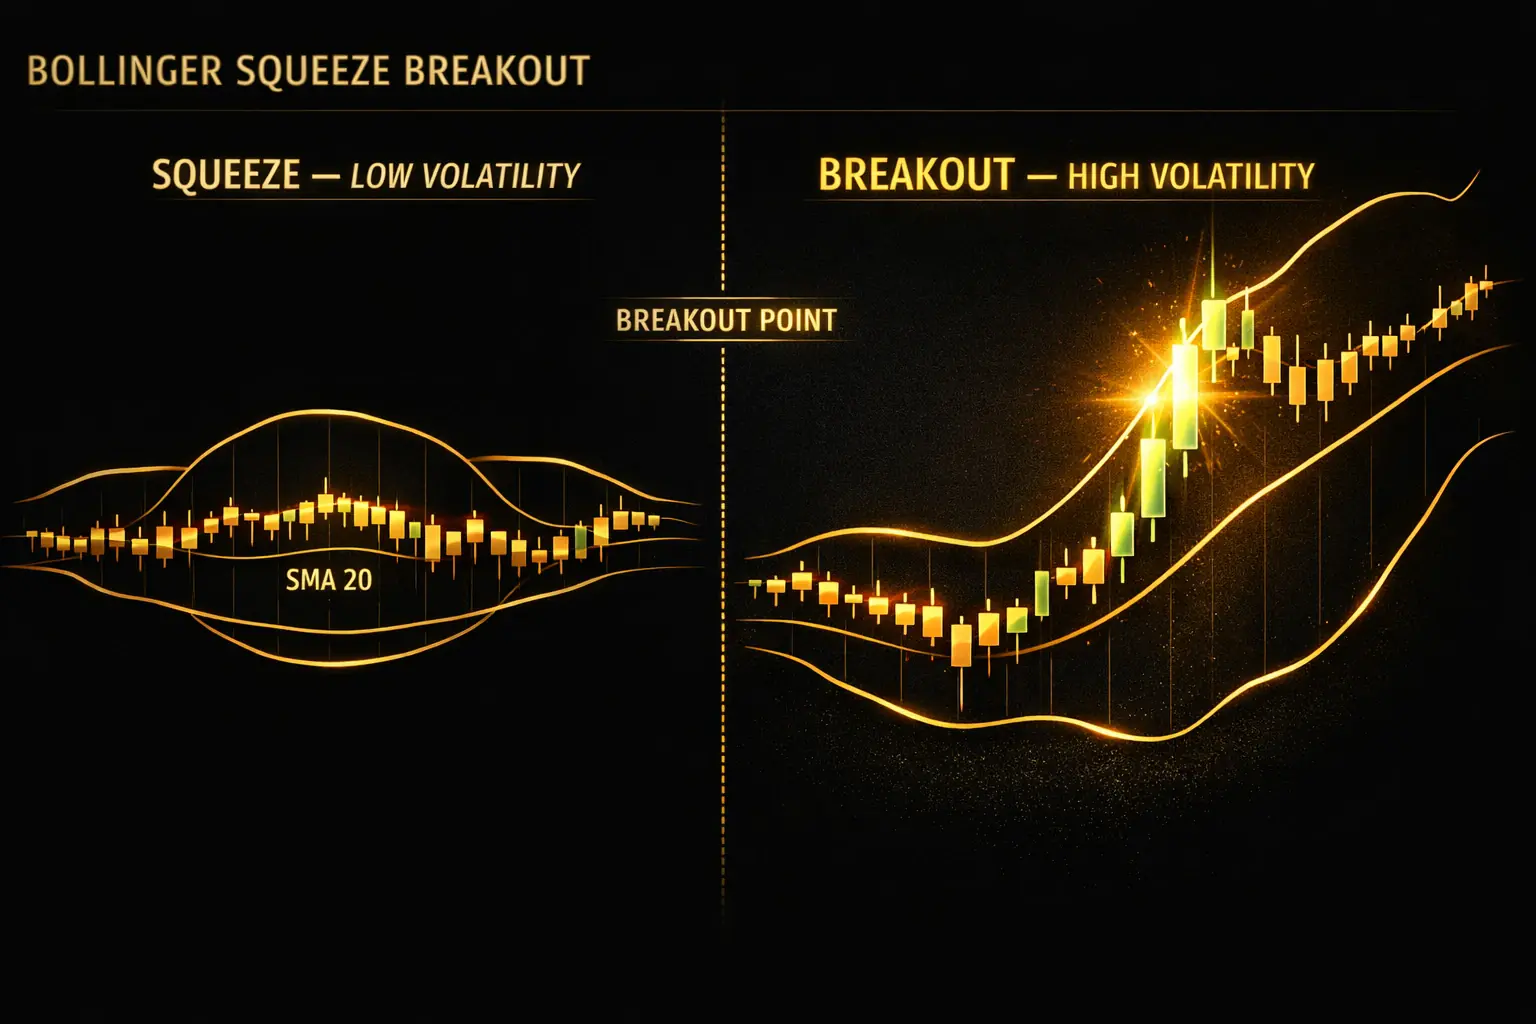
The classic squeeze-breakout pattern: bands contract tightly (low volatility), then expand explosively as price breaks out.
How to trade a squeeze:
- Identify unusually narrow bands — visually, they should look tighter than any contraction in the last 3-6 months.
- Wait for the breakout — a decisive candle closing outside the bands in either direction.
- Enter in the direction of the breakout on the close of that candle.
- Stop-loss goes just inside the opposite band.
- Target is measured by the width of the squeeze projected from the breakout point.
The key word here is "decisive". A wick that pokes outside the bands but closes back inside is not a breakout — it's a fakeout. Wait for the close.
One important warning: squeezes can break in either direction. Don't guess the direction before the break. Indian crypto traders often lose money by assuming "it must go up from here" before the breakout actually happens. The market doesn't care about your bias.
The band walk — trend rider's friend
Now for the opposite pattern. When price is trending strongly, it doesn't just touch a band and bounce — it walks the band, hugging it for many candles in a row. This is called a "band walk" and it's one of the most misunderstood patterns in trading.
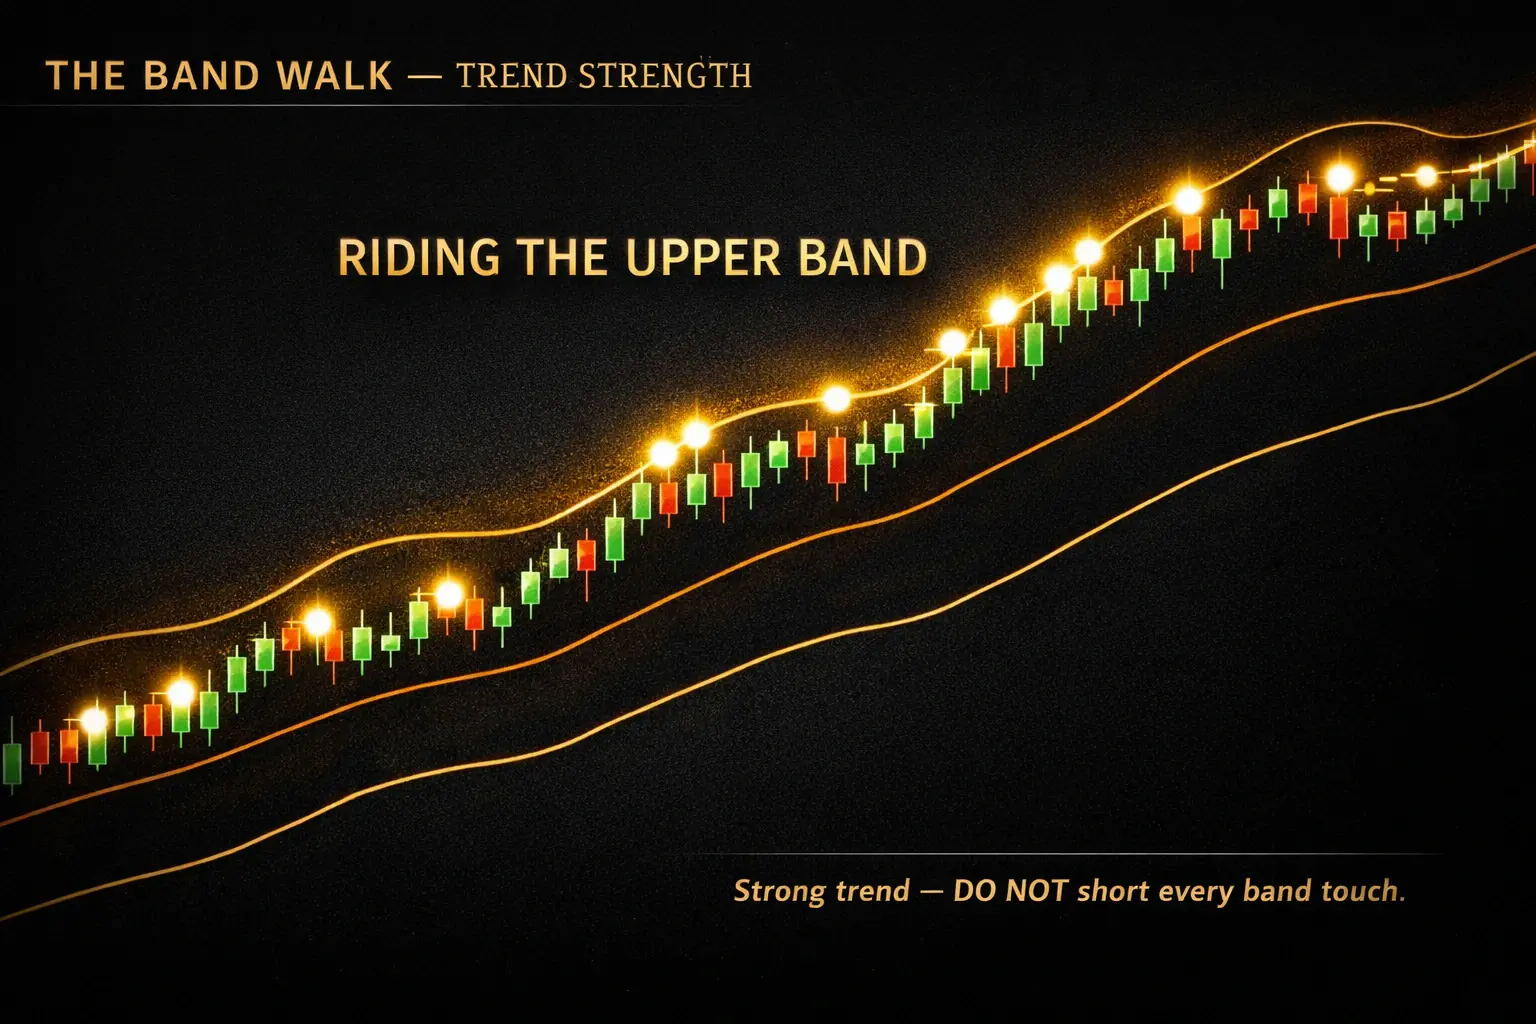
When price rides the upper band for many candles, the trend is strong — do not short every touch!
The classic retail mistake: seeing price touch the upper band, thinking "overbought", and shorting. In a strong uptrend, this is catastrophic. Crypto bull runs frequently see price walk the upper band for 15-25 candles. Each short gets stopped out, and capital bleeds out rapidly.
How to identify a band walk versus a band touch:
- Band walk: Price touches the upper band, pulls back slightly (not reaching the middle band), then touches the upper band again. This pattern repeats.
- Band touch (reversal setup): Price touches the upper band, then pulls back all the way to the middle band or lower. Momentum is weaker.
For band walks, the trade is with the trend, not against it. Enter on small pullbacks toward the middle band, with stops below the last swing low. Target... keep riding until price fails to make a new high after touching the middle band.
Mean reversion with Bollinger Bands
In ranging, sideways markets, Bollinger Bands become a mean-reversion trader's best friend. The concept: price tends to oscillate between the bands, bouncing off the upper band back toward the middle, then off the lower band back up again.
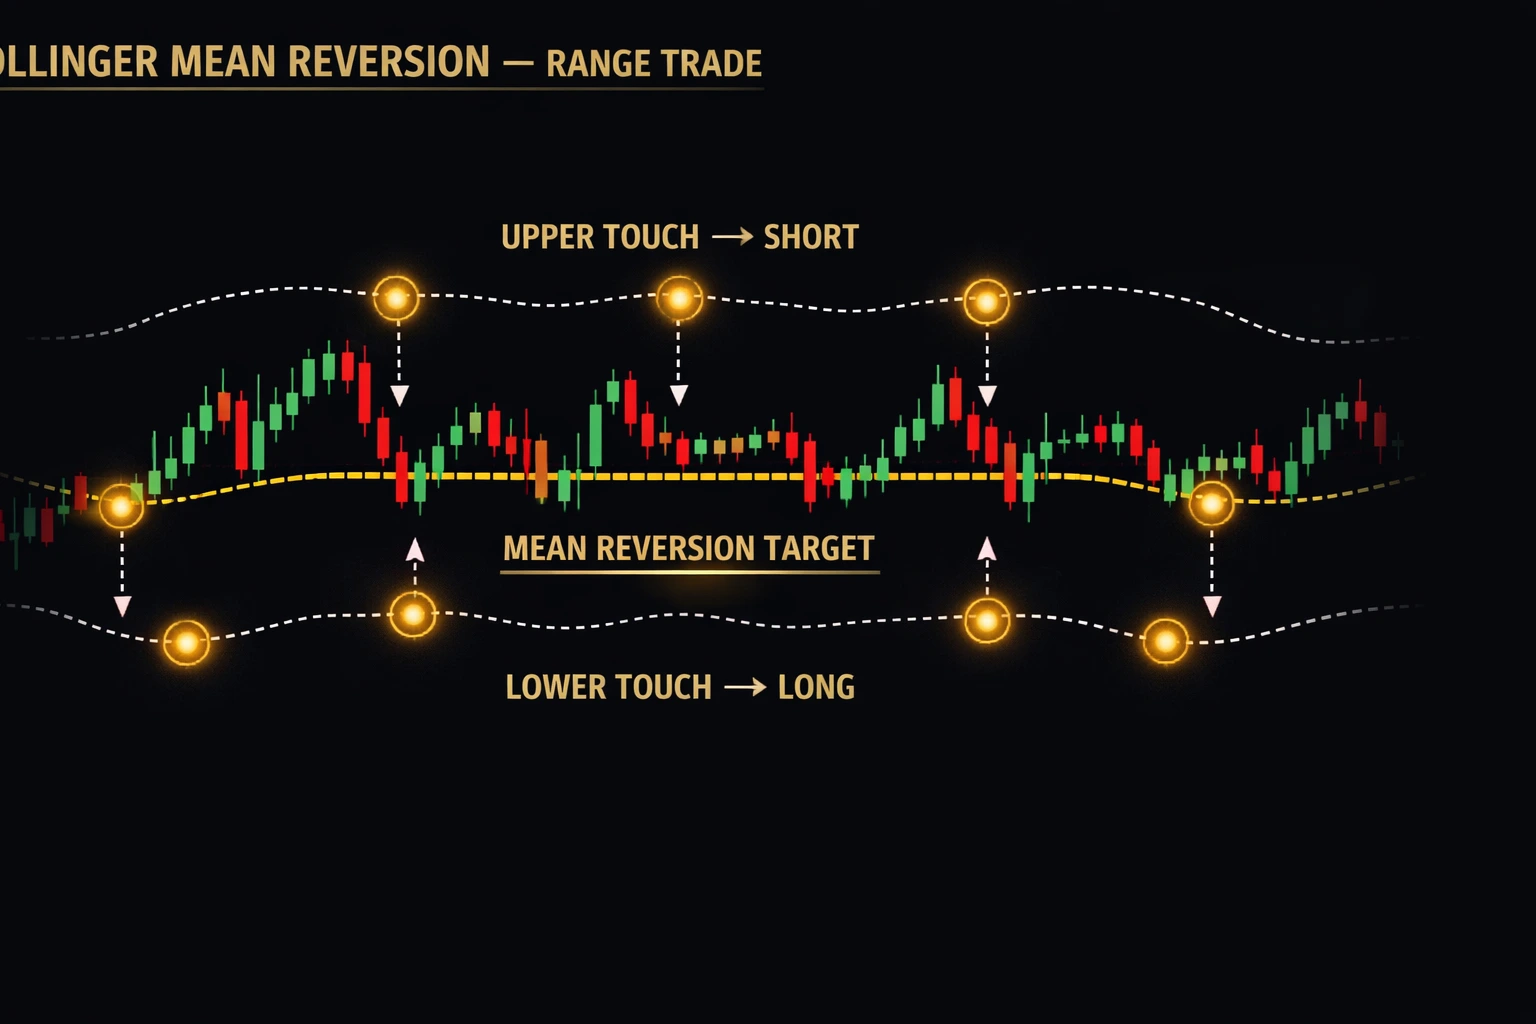
In ranging markets, price bounces between bands predictably. The middle band is the magnet.
Mean-reversion setup (for range-bound markets only):
- Confirm the market is ranging: the 20-period SMA is flat, no clear up- or downtrend for at least 30-50 candles.
- When price touches the lower band with RSI also below 30, enter long.
- Target: the middle band (SMA 20) for partial exit, upper band for full exit.
- Stop-loss: just below the swing low that created the band touch.
- Reverse for short trades: upper band touch with RSI above 70.
Critical: this strategy ONLY works in ranges. Using it in a trending market will bleed you out because band walks are the default behavior of trends. Always check the 20-period slope first.
Three complete Bollinger strategies
Strategy 1 — The Squeeze Breakout (best risk-reward)
Described above. This is the single most profitable Bollinger pattern when traded with discipline. Wait for the breakout, enter on the close, stop inside the opposite band, target a move equal to the band width at the squeeze.
Frequency: 1-3 setups per month per pair. Low frequency, high quality.
Strategy 2 — Mean Reversion in Ranges
Described above. Suitable for sideways markets. Requires discipline to sit out trending phases completely. Best on altcoins that tend to chop sideways for long stretches between major moves.
Frequency: 3-8 setups per month per pair in suitable market conditions.
Strategy 3 — The Band Walk Pullback Entry (trend continuation)
When price is in a clear band walk, don't try to call the top. Instead, wait for a pullback toward the middle band, then enter in the direction of the trend.
- Identify an ongoing band walk — price has touched the upper band at least 3 times in the last 15 candles.
- Wait for price to pull back toward (but not through) the middle SMA.
- Enter long on the first candle that turns back up.
- Stop-loss below the pullback low.
- Target: the previous band touch high, with a trailing stop.
This is one of the highest-probability trend-following entries in technical analysis. For more on aligning Bollinger Bands with broader trend setups, see our swing trading guide.
Common Bollinger Band mistakes
Mistake 1: Shorting every upper band touch. As covered above, this destroys accounts in trending markets. Always check the market regime first.
Mistake 2: Ignoring band width. Narrow bands and wide bands require completely different strategies. Know which regime you're in before entering.
Mistake 3: Trading squeezes without waiting for the break. Trying to guess the breakout direction before it happens is gambling, not trading. Wait for the close outside the band.
Mistake 4: Using Bollinger Bands alone. Combining with RSI, volume, or support/resistance filters out 70% of false signals.
Mistake 5: Changing settings constantly. The (20, 2) defaults have worked for 40+ years across every market. Don't tinker unless you have a specific, tested reason.
Combining Bollinger Bands with other tools
Like all indicators, Bollinger Bands reveal their best signals when combined with other tools:
- + RSI: Band touch + RSI extreme is a high-probability reversal signal in ranges.
- + Volume: Squeeze breakouts with volume expansion are far more reliable than breakouts on weak volume. See our volume profile guide for deeper volume analysis.
- + Support/Resistance: Band touches at known S/R levels carry double weight.
- + Trend Filter: Use a 50 or 200-period EMA to determine trend direction, then take only band-touch trades in the direction of trend.
DRISHTIKON — Bollinger Bands ready on every chart
Inside CHAKRAVYUH, the DRISHTIKON chart module displays Bollinger Bands (20, 2) by default alongside EMAs 21 and 55, letting you instantly read volatility regime while the A.I. Trade Oracle evaluates every setup. No manual indicator setup, no missed squeezes.
Explore Chakravyuh →Bollinger Bands are not a magic system — no indicator is. But when understood deeply, they give you two things most traders lack: a clear read on market regime (volatile or calm, trending or ranging), and precise context for where price sits within that regime. Combined with good risk management and a willingness to wait for high-quality setups, they remain one of the most practical tools in any trader's kit.
Frequently asked questions
What do Bollinger Bands tell you in crypto trading?
Bollinger Bands show two things simultaneously: volatility (how wide or narrow the bands are) and relative price extremes (how close price is to the upper or lower band). In crypto, they're especially useful for spotting low-volatility periods that often precede big moves.
What are the best Bollinger Bands settings?
The default setting is a 20-period simple moving average with bands at 2 standard deviations above and below. This has decades of proven use. Some traders use 2.5 or 3 standard deviations for less frequent but more extreme signals. Stick with (20, 2) until you have strong reasons to change.
Should I buy when price touches the lower Bollinger Band?
Not automatically. In ranging markets, touches of the lower band often signal good buying opportunities. But in strong downtrends, price can 'walk the lower band' for many candles — buying each touch produces losses. Always check the broader trend first.
What is a Bollinger Band squeeze?
A squeeze occurs when the upper and lower bands contract very close together, indicating unusually low volatility. Historically, low-volatility periods precede high-volatility moves. Traders watch squeezes carefully because a breakout in either direction often follows within a few candles.
Do Bollinger Bands work in crypto as well as stocks?
Yes — arguably better. Crypto's higher volatility creates clearer band touches and more dramatic squeeze-breakout patterns than in traditional markets. However, crypto also trends more violently, which means walking the band is more common and mean-reversion strategies need stricter filters.
cRyPtO sMaRt is not registered with SEBI and does not provide investment advice. Crypto trading carries significant risk of capital loss. The strategies, examples, and opinions shared in this article are for educational purposes only. Always do your own research and consult a SEBI-registered financial advisor before investing real capital. Past performance does not guarantee future results.