
- What is a chart pattern, in simple words?
- Why patterns work — the psychology behind them
- Pattern 1 — Head and Shoulders (reversal)
- Pattern 2 — Double Top and Double Bottom
- Pattern 3 — Triangles (continuation)
- Pattern 4 — Flags and Pennants (continuation)
- Pattern 5 — Cup and Handle (bullish continuation)
- How to trade patterns without common mistakes
- Frequently asked questions
What is a chart pattern, in simple words?
A chart pattern is a shape that prices form on a trading chart. When you zoom out and look at a price chart, you will notice the price does not move randomly. It makes shapes. Triangles. Rectangles. Curves. Peaks and valleys that look similar to each other.
These shapes are not random either. They repeat, across different coins, different timeframes, different years. And when a certain shape completes, the price often moves in a predictable direction next. This is what chart patterns are — repeating shapes that give you a clue about what might happen next.
Imagine you are watching two friends have an argument. At first, both are shouting. Then one starts losing confidence — speaking less, hesitating. You can tell, from their body language, that this person is about to give up. You saw the pattern of body language before the actual outcome. Chart patterns work the same way. They show you the "body language" of a price, giving you advance warning about what might come next.
This is called technical analysis — the study of price charts to predict future price moves. It is one of the three main ways traders make decisions (the other two are fundamental analysis and on-chain analysis).
Now, an important warning. Chart patterns are probabilities, not guarantees. A pattern might "say" prices should go up, and prices go down instead. That is normal. Even the best patterns only work 60-70% of the time. What makes patterns valuable is that, used with proper risk management, even a 60% win rate can make you profitable over many trades.
In this guide, we will cover the five most powerful chart patterns that every beginner should know. Each one has helped traders make money for decades — including me. You do not need to be a math genius. You do not need special software. You just need to learn what each pattern looks like, what it means, and how to trade it with proper stop-losses.
Why patterns work — the psychology behind them
Before we dive into individual patterns, let us understand why they work. If you understand why, you will remember the patterns much more easily.
Chart patterns work because markets are made of humans, and humans behave in repeated patterns. Prices do not move in random jumps — they move because thousands of people are buying and selling, each with emotions and opinions.
For example, think about a stock or coin that has been rising for weeks. At a certain high price, some buyers start saying: "this is getting expensive, I'll take profits." They sell. Prices dip a little. New buyers come in thinking it is a bargain. Prices rise again and test the same high level. More profit-taking happens. Prices dip again.
This back-and-forth at a certain price level is called resistance. It shows on the chart as a flat horizontal line where price keeps failing to break through. That flat line is a pattern. And if the price finally breaks above it, traders around the world see the breakout and start buying — which creates a strong upward move. The pattern predicted the move because the pattern caused the move.
This is the key insight. Patterns are not magic. They work because:
- Humans react to past prices. If price fell sharply from ₹100 before, traders remember ₹100 as a "dangerous" level. When price approaches ₹100 again, some will sell. This creates a pattern.
- Many traders see the same patterns. Chart patterns are taught in every trading course. Millions of traders worldwide watch for them. When a pattern completes, those millions act together — which moves the price in the expected direction.
- Patterns reflect underlying psychology. A head-and-shoulders pattern at a market top is not just a shape — it is the visual footprint of buyers running out of strength after euphoria peaks.
This is also why patterns work better on higher timeframes (daily, weekly) than on smaller ones (1-minute, 5-minute). On higher timeframes, more traders are watching, which means the "self-fulfilling prophecy" effect is stronger.
With that foundation, let us look at the five patterns every crypto trader should know by heart.
Pattern 1 — Head and Shoulders (reversal)
The head and shoulders pattern is the most famous chart pattern. It signals a likely reversal from an uptrend to a downtrend. When you spot it correctly, it is one of the most reliable patterns you can trade.
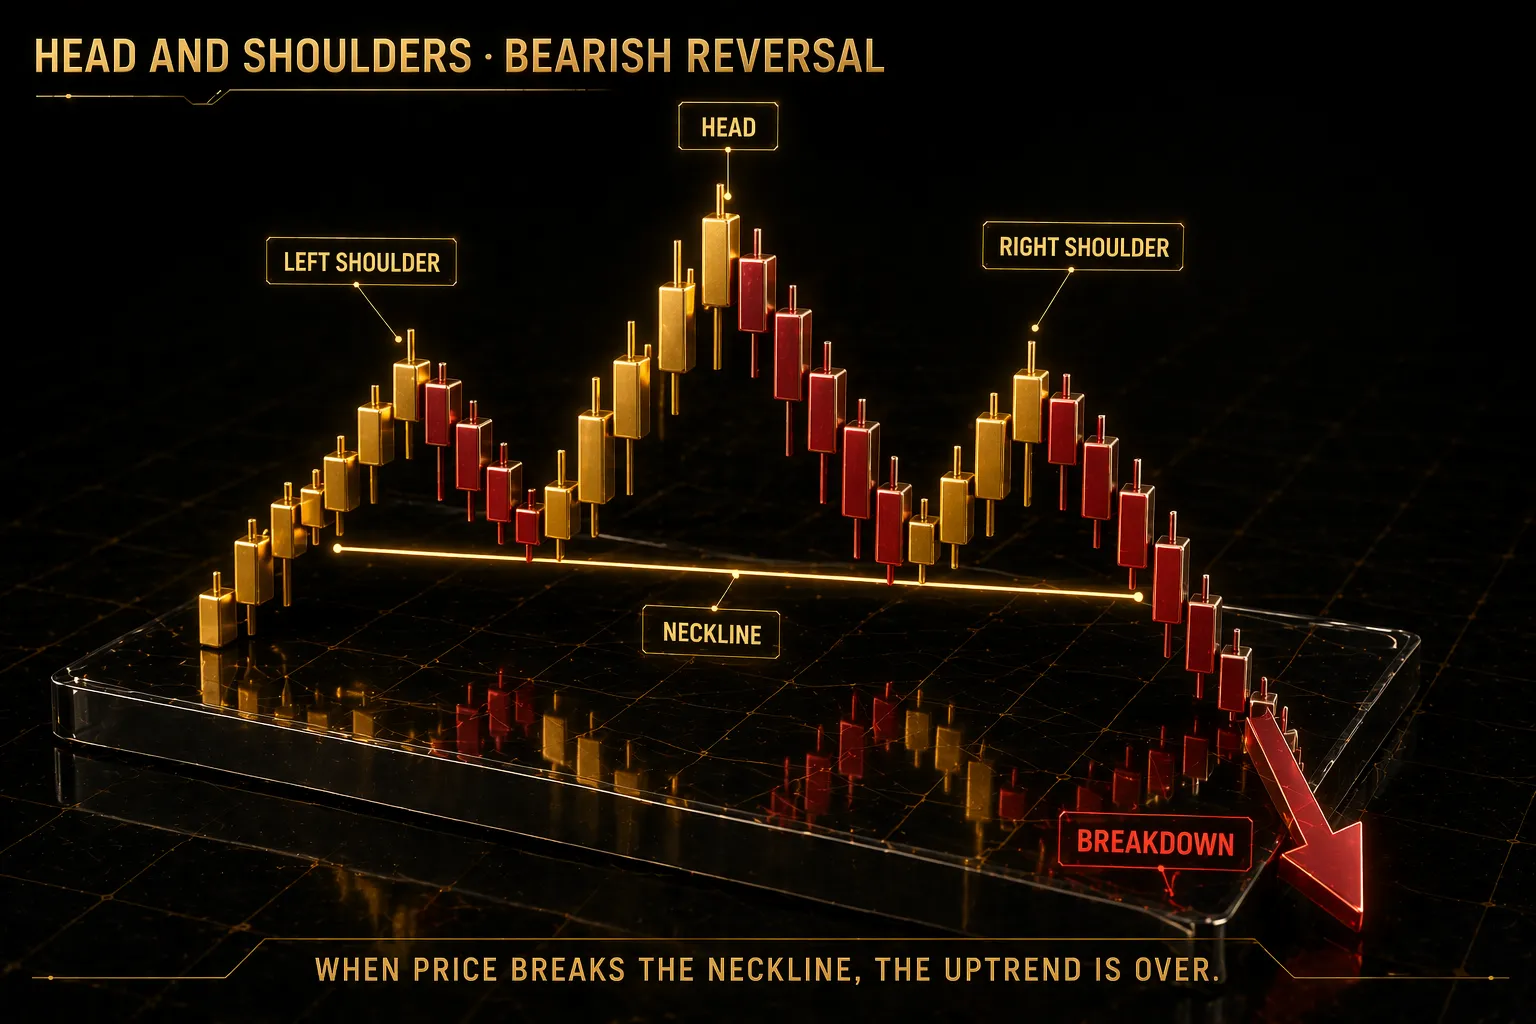
The head and shoulders pattern — three peaks where the middle is highest, signaling trend exhaustion.
What it looks like:
Imagine three peaks in price, like mountains. The left shoulder is a smaller peak. The head is a taller peak that follows. Then a right shoulder — another smaller peak, roughly the same height as the left shoulder. Below the two shoulder valleys runs an imaginary horizontal line called the neckline.
What it means:
The uptrend made a higher high (the head) but could not make a new higher high after that (the right shoulder failed to beat the head). This shows buyers are running out of strength. When price then breaks below the neckline, sellers take over, and a new downtrend typically begins.
How to trade it:
- Wait for the right shoulder to complete (lower than the head).
- Wait for price to break below the neckline with strong volume. Do not enter before the break.
- Enter a short position (or sell your existing longs) on the break.
- Set stop-loss above the right shoulder's peak.
- Profit target: the height from the head down to the neckline, projected below the neckline. For example, if the head was at ₹100 and neckline at ₹85 (15 apart), target is ₹85 - 15 = ₹70.
Variations:
There is also an inverse head and shoulders, which is the opposite — three valleys instead of three peaks — signaling a reversal from downtrend to uptrend. The trade logic flips: wait for a break above the neckline, enter long, stop-loss below the right shoulder low, target projected upward.
Common mistake beginners make: Entering before the neckline breaks. Many "patterns" never complete — prices can recover and continue the uptrend. Always wait for the neckline break before acting. Patience is the difference between a winning trade and a losing one here.
This pattern pairs well with RSI divergence — if RSI shows lower highs while price forms the head-and-shoulders, your probability of a successful short increases significantly.
Pattern 2 — Double Top and Double Bottom
The double top and double bottom are simpler patterns than head and shoulders. They also signal trend reversals — and they are very common in crypto.
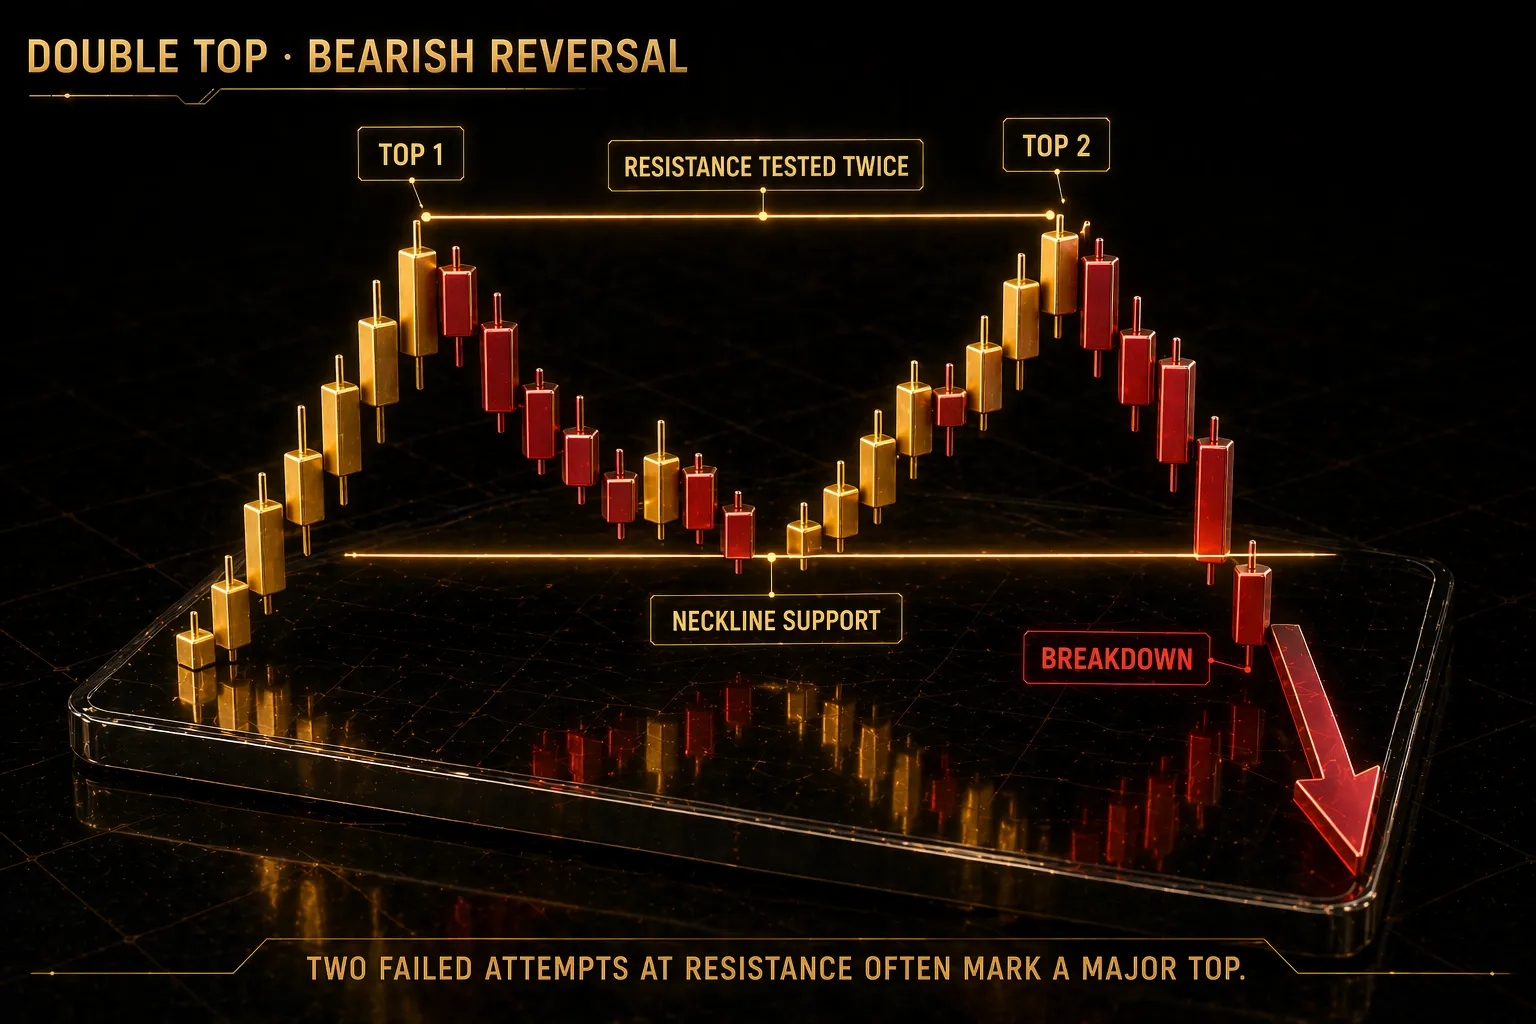
The double top — two peaks at the same price level that fail to push higher. A classic reversal signal.
What a double top looks like:
Price rises to a high. Pulls back. Rises again to roughly the same high. Pulls back again. The two peaks form an "M" shape on the chart. The low between the two peaks is the neckline support.
What it means:
Buyers tried twice to push prices higher, and failed both times at the same level. This shows strong resistance and weak buying pressure. When price then breaks below the neckline support, the trend has reversed downward.
How to trade a double top:
- Identify two price peaks at roughly the same level (within 1-3% of each other).
- Draw the neckline — the horizontal line along the valley between the peaks.
- Wait for price to break below the neckline. Confirm with good volume on the break.
- Enter short or sell your existing long position on the break.
- Stop-loss: above the higher of the two peaks.
- Profit target: the distance from the peaks down to the neckline, projected below the neckline.
The double bottom works in reverse:
Two valleys at the same price level form a "W" shape. Buyers tried twice to push prices down and failed. Once price breaks above the neckline (the peak between the two valleys), the trend reverses upward. Trade logic flips: enter long on the break, stop below the lower of the two valleys, target projected upward.
Why double patterns work:
Think about what happens at a double top emotionally. The first peak fails — sellers are happy, they took profits. Buyers try again, thinking "this time it'll break through". Second peak also fails. Now buyers lose confidence. Sellers sense weakness. Supply overwhelms demand. The market reverses.
Common mistake: Identifying a "double top" after only the first peak forms. You need two clear attempts at the same level before you can call it a pattern. Patience. Wait for the second peak to fail and the neckline to break.
Double tops and bottoms often confirm signals from MACD momentum analysis — when MACD shows bearish divergence alongside a double top, the probability of a reversal increases significantly.
Pattern 3 — Triangles (continuation)
Triangles are among the most common patterns in crypto. They appear during consolidation phases — periods when price is neither strongly trending up nor strongly trending down, but squeezing tighter and tighter before a breakout.
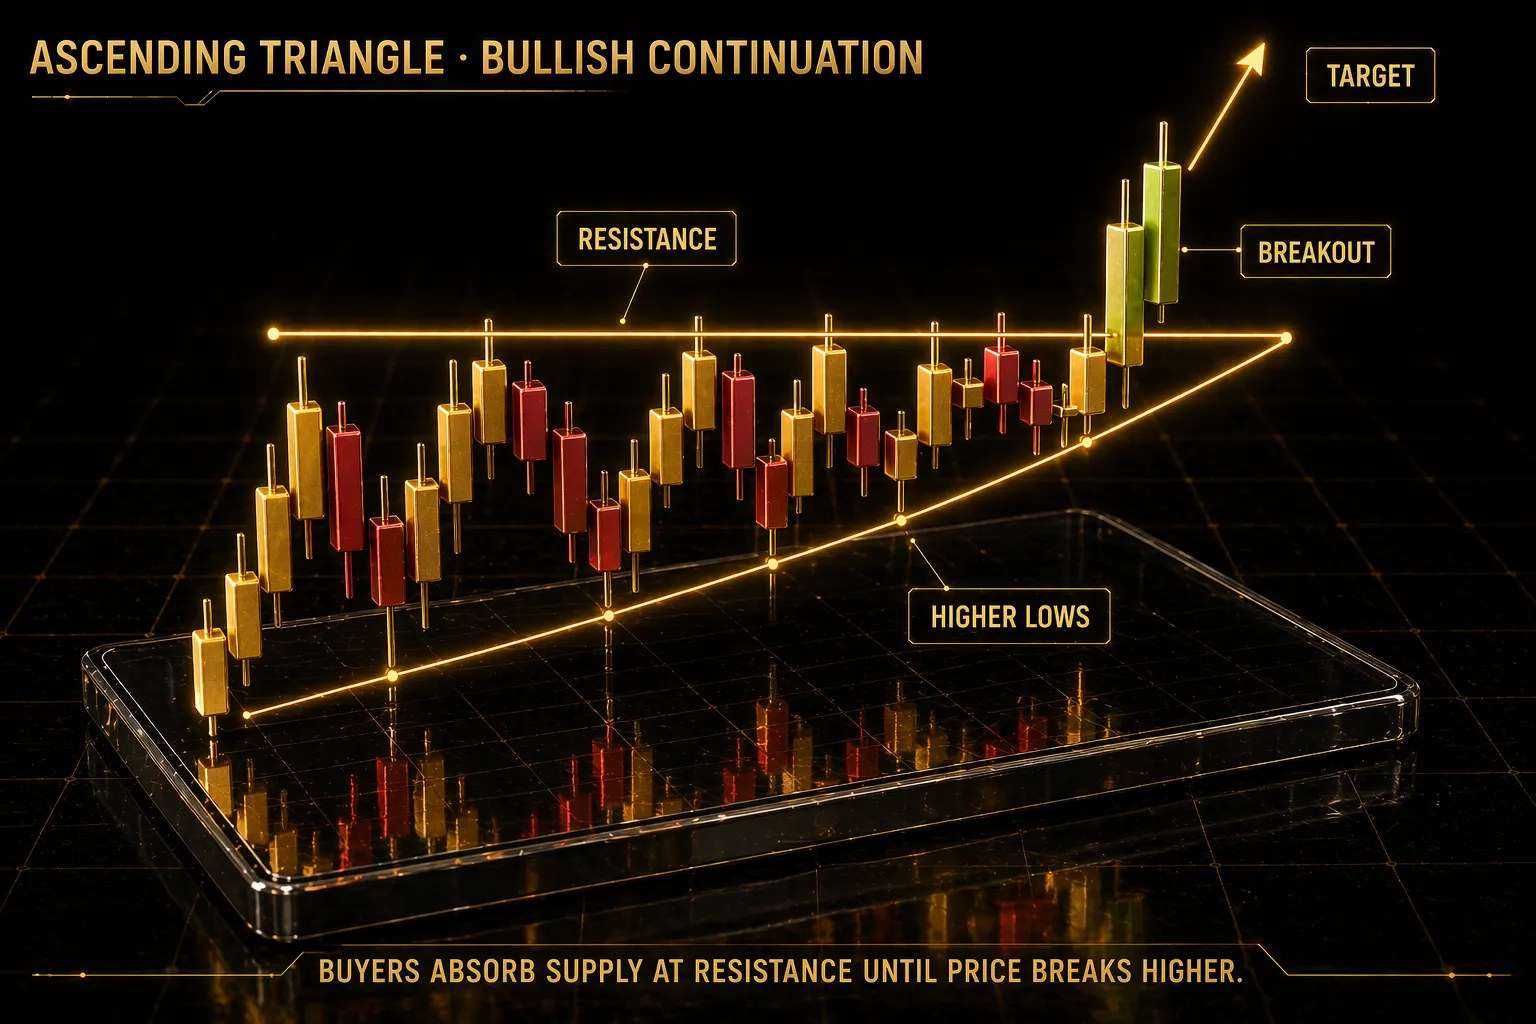
Ascending triangle with breakout — rising lows pushing against flat resistance until buyers win.
There are three main types of triangles:
1. Ascending triangle (bullish). A flat horizontal resistance line on top, with a rising support line below making higher lows. The triangle slopes upward. Buyers keep stepping in at higher prices while sellers defend one flat level. Eventually, buyers win and price breaks above resistance.
2. Descending triangle (bearish). The opposite — a flat horizontal support line below, with a falling resistance line above making lower highs. Sellers keep pushing price lower while buyers defend one flat level. Eventually sellers win and price breaks below support.
3. Symmetrical triangle (neutral). Both lines converge — support rising, resistance falling. Neither side dominates. Price can break either way. This is a continuation pattern — it usually breaks in the direction of the trend that existed before the triangle formed. If the prior trend was up, expect an upward breakout. If down, expect downward.
How to trade triangles:
- Identify the triangle by drawing support and resistance trendlines (requires at least 2 touches on each).
- Wait for a clean breakout with volume. Low-volume breakouts often fail.
- Enter in the direction of the breakout — long on a break above, short on a break below.
- Stop-loss on the opposite side of the triangle (the side you did not break).
- Profit target: the widest part of the triangle, projected from the breakout point. For example, if the triangle's widest point was 10% and it breaks upward at ₹100, target is ₹110.
Why triangles form:
Triangles reflect reducing volatility before a big move. Buyers and sellers are becoming equally matched, compressing the range. But this equilibrium is temporary — eventually, one side gives up, and the release of pressure creates a strong directional move.
Common mistakes with triangles:
- Drawing triangles that are not really there. A triangle needs at least 4 clear touch points (2 on each trendline). Forcing a triangle onto random price action is a mistake.
- Entering on a fake breakout. Many triangles have "fakeout" breakouts — price breaks briefly then reverses. Wait for a candle to close outside the triangle, preferably with strong volume, before entering.
- Ignoring the prior trend. Symmetrical triangles usually continue the prior trend. Against that context, pay closer attention to which side breaks.
Triangles pair very well with volume analysis — proper breakouts come with volume spikes; fake breakouts do not.
Pattern 4 — Flags and Pennants (continuation)
Flags and pennants are short-term continuation patterns. They form during a brief pause in a strong trend, before the trend continues in the same direction. They are among the easiest patterns to trade because they form quickly and resolve quickly.
What a flag looks like:
A strong, sharp price move (up or down) followed by a short period of sideways or slightly counter-trend consolidation in a tight parallel channel. The original sharp move is called the flagpole. The consolidation is the flag.
Example of a bullish flag: Bitcoin shoots from ₹40 lakh to ₹50 lakh in a few days (the flagpole). Then it consolidates sideways between ₹48-50 lakh for a week (the flag). Then it breaks above ₹50 lakh and continues upward.
What a pennant looks like:
Similar to a flag, but instead of a parallel channel, the consolidation forms a small symmetrical triangle (a tiny triangle compared to the prior move). Flag and pennant mean similar things — the only difference is the shape of the consolidation.
What they mean:
After a sharp price move, the market needs to "catch its breath". Some traders take profits, new buyers step in at slightly lower prices. This creates the flag. The overall direction has not changed — momentum is just pausing. When the flag breaks in the original direction, the trend usually continues for another move similar in size to the flagpole.
How to trade flags and pennants:
- Identify a strong sharp prior move (the flagpole).
- Identify a short consolidation in the opposite direction (the flag or pennant).
- Wait for a breakout from the flag in the same direction as the flagpole.
- Enter on the breakout. Bullish flag = long position. Bearish flag = short position.
- Stop-loss: on the opposite side of the flag.
- Profit target: the length of the flagpole projected from the breakout point. If the flagpole was 20%, expect roughly a 20% continuation move after the break.
Why flags are powerful:
Flags usually resolve within days or weeks — much faster than major reversal patterns. This means:
- Faster profits (good for traders who want quick setups).
- Lower overnight risk (less time exposed to market uncertainty).
- Clean stop-loss placement (the flag has tight boundaries).
Flags work especially well during strong trending markets — exactly when momentum traders want to jump in without missing the move. They pair well with swing trading strategies, where flags can be ideal entry points during longer trends.
Common mistake: Expecting flags during sideways markets. Flags only appear during strong trends. In a sideways, choppy market, what looks like a flag is often just noise that goes nowhere.
Pattern 5 — Cup and Handle (bullish continuation)
The cup and handle is a longer-term bullish pattern. It is one of the most reliable patterns for predicting strong breakouts — but it takes patience because it takes weeks or months to form.
What it looks like:
Imagine a tea cup seen from the side. Price rises to a peak, then gradually falls in a smooth curve, reaches a low, and gradually rises back to the original peak level. This rounded "U" shape is the cup. Then price pulls back slightly in a small downward drift that looks like the cup's handle. Finally, price breaks above the cup's rim and continues higher.
What it means:
The cup forms because the original peak created resistance. As price fell and then recovered, most of the sellers near that level have already sold. The smooth curve down and back up shows a gradual shift from pessimism to optimism. The handle is a small final test where weak hands sell before the real breakout. When price clears the cup's rim with volume, a strong new uptrend typically follows.
How to trade cup and handle:
- Identify the cup — a prior peak, smooth rounded decline, smooth rounded recovery back to near the peak. Takes 1-6 months typically in crypto.
- Wait for the handle — a small pullback of 10-15% from the cup's rim, lasting 1-4 weeks.
- Enter on a breakout above the cup's rim (the original peak price), with volume confirmation.
- Stop-loss: below the handle's low.
- Profit target: the depth of the cup projected upward from the breakout. If the cup was 30% deep, expect about 30% continuation.
Why cup and handle works so well:
It represents a complete psychological cycle — greed at the original peak, fear during the decline, disbelief during the recovery, caution during the handle, then conviction on the breakout. By the time the breakout happens, all the weak holders have been shaken out, and the remaining buyers are strong-handed. This creates a durable new uptrend.
Crypto examples:
Bitcoin has formed multiple cup-and-handle patterns on long timeframes over the years. Each time, the breakout led to significant new highs. Smaller altcoins with strong fundamentals also form this pattern — often the most profitable long-term setups come from cup-and-handle breakouts in mid-cap coins.
Common mistakes with cup and handle:
- V-shaped cups instead of U-shaped. A true cup is rounded, taking weeks. A sharp V-bottom is not a cup — it is just a quick reversal, less reliable.
- No handle, just cup. The handle is important. It provides the final confirmation that weak sellers are gone. Breakouts without the handle are less reliable.
- Entering during the cup. The pattern is only useful after the breakout. Trying to "buy the cup bottom" is guessing — many cups fail to complete and price continues lower.
Cup and handle setups pair well with Fibonacci retracement levels — if the cup's bottom aligns with a key Fibonacci level (like 61.8%), the pattern becomes even more reliable.
How to trade patterns without common mistakes
Knowing chart patterns is only half the battle. The other half is trading them properly. Here are the rules professional traders follow.
Rule 1 — Always wait for confirmation. A pattern is not complete until the breakout happens with volume. Entering early is one of the biggest beginner mistakes. Yes, you will sometimes miss the best entry, but you will avoid many false patterns that never actually break. Patience beats speed.
Rule 2 — Always set a stop-loss before entering. Every pattern has a clear invalidation point — a price where the pattern is clearly failing. If a double top breaks below the neckline, your stop-loss is above the second peak. If price breaks back above the second peak, the pattern has failed, and you exit. No exceptions.
Rule 3 — Use multiple timeframes. A pattern on the 4-hour chart is less reliable than the same pattern on the daily chart. Confirm patterns on higher timeframes first, then look for entries on lower timeframes. Daily patterns give the best risk-reward for most retail traders.
Rule 4 — Combine patterns with other signals. Chart patterns work best combined with other tools. Pair them with RSI, MACD, Bollinger Bands, and volume analysis. When three or four signals agree, your probability improves dramatically.
Rule 5 — Pay attention to volume. Good breakouts come with volume spikes. A breakout on low volume is suspicious — often a fake. Volume is the fuel that makes patterns resolve properly.
Rule 6 — Do not chase broken patterns. If you missed the breakout and price has already moved 15%, do not jump in. Wait for a retest of the breakout level (often price pulls back to touch it before continuing). If you can enter on the retest, your stop-loss is tighter and your risk is smaller.
Rule 7 — Accept that patterns fail. Even good patterns only work 60-70% of the time. Every trader has losing trades from perfect-looking patterns. What matters is that when they work, your gains are bigger than your losses on the failures. This is only possible with proper stop-losses.
Rule 8 — Size positions correctly. Never risk more than 1-2% of your account on any single trade. This means your stop-loss distance and position size together should never exceed 2% of your capital at risk. Even in a streak of 10 losses, you still have 80%+ of your capital to recover.
Rule 9 — Keep a trade journal. Write down every pattern you trade — which pattern, which coin, entry price, stop-loss, target, and outcome. Over time you will see which patterns work best for you personally, which you struggle with, and where your mistakes repeat. This one habit separates professional traders from amateurs.
VIDYA MANDAL — Chart patterns taught with real crypto examples
VIDYA MANDAL is our structured knowledge library covering chart patterns in depth — each pattern explained with multiple real crypto examples, failure modes, confirmation signals, and practical entry and exit checklists. If you want to master technical analysis without wasting years, this is the shortcut.
Explore the Store →A final thought. Chart patterns are tools, not magic. They give you probabilities, not certainties. Master the five patterns in this guide, apply them with discipline, manage your risk carefully — and over time, you will develop the pattern-reading instinct that takes most traders years to build. The patterns have worked for decades across stocks, commodities, and forex. They work in crypto too. And once you learn them, they work forever.
Join our Telegram community where we share real-time pattern setups and analysis. Our crypto trading courses include full technical analysis modules with live pattern case studies. Start with one pattern. Master it. Add the next. Build the library in your head — that is how professional traders do it.
Frequently asked questions
Which chart pattern is most reliable for crypto trading?
For beginners, the head and shoulders pattern on daily or weekly charts is historically the most reliable — when properly confirmed by a neckline break with volume. Cup and handle is another very reliable pattern but takes longer to form. Triangles and flags work well for faster trading. Double tops and bottoms are excellent for reversal identification. No single pattern is perfect — always combine with volume and risk management.
How long does a chart pattern take to form in crypto?
Depends on the timeframe you are watching. On daily charts, head and shoulders or double tops typically take 2-8 weeks. Flags and pennants form in days to 2 weeks. Cup and handle patterns can take 1-6 months. On hourly charts, patterns form much faster but are also much less reliable. Daily charts offer the best balance of reliability and reasonable trade duration for most retail traders.
Do chart patterns work in crypto the same way as in stocks?
Yes. Chart patterns reflect human psychology, and human psychology is the same across all markets. The same patterns that work in stocks and commodities work in crypto — often with even stronger moves because crypto is more volatile. However, crypto markets run 24/7 (unlike stock markets), so pattern completion can happen at unusual hours. Always set alerts for breakouts rather than trying to watch charts live.
What is the safest way to trade chart patterns as a beginner?
Follow five rules strictly. One, only trade patterns on daily or weekly charts (more reliable). Two, wait for confirmed breakouts with volume before entering. Three, always set a stop-loss at the pattern's invalidation point. Four, never risk more than 2% of your capital on a single trade. Five, start small — practice with tiny positions for 3-6 months before increasing size. Journaling every trade is essential.
Can I trade chart patterns without any indicators?
Yes, pure price action trading using only patterns and support/resistance is valid. However, confirmation from indicators like RSI, MACD, or volume significantly improves win rate. For beginners, using 1-2 indicators as confirmation (not as primary signal) creates better results than patterns alone. Volume is the single most important complement to chart patterns.
cRyPtO sMaRt is not registered with SEBI and does not provide investment advice. Crypto trading carries significant risk of capital loss. The strategies, examples, and opinions shared in this article are for educational purposes only. Always do your own research and consult a SEBI-registered financial advisor before investing real capital. Past performance does not guarantee future results.