- What is tokenomics, in simple words?
- Why tokenomics matters more than hype
- Supply basics — max, circulating, locked
- Distribution — who got the tokens first
- Vesting schedules — the hidden sell pressure
- Utility — why does the token exist?
- Inflation and burns — how supply changes over time
- Red flags that save you from bad projects
- Frequently asked questions
What is tokenomics, in simple words?
Tokenomics is a word made from two words — "token" and "economics". It simply means the economics of a crypto token. How many tokens exist? Who owns them? Why do people want to buy or hold them? What makes the token valuable or worthless?
Think of tokenomics like the constitution of a country. A country's constitution says: how many citizens there are, what rights they have, how new citizens are added, what keeps the currency stable. A token's tokenomics says: how many tokens exist, who holds them, how new tokens are created (or destroyed), and what keeps the token valuable.
This matters because most of a crypto's long-term price is determined by its tokenomics. Good tokenomics can make a coin grow steadily for years. Bad tokenomics can crash a coin even if the project is technically excellent.
Imagine you are considering two coins:
Coin A: Total supply 21 million. About 19 million already in circulation. Very slow new coin creation. No single big holder owns more than 2%. Miners must buy hardware and electricity to earn new coins — real work, not free handouts.
Coin B: Total supply 100 billion. Only 2 billion in circulation. The founding team holds 40%, with most locked for 6 more months. Venture capital investors hold another 30%, locked for 12 months. When locks expire, massive selling pressure will hit.
Both coins might have similar technology. Both might have cool websites. But Coin A's tokenomics protect its value. Coin B's tokenomics almost guarantee it will crash once lock-ups expire.
Most beginners never check tokenomics. They look at the chart, read some hype on Twitter, and buy. Then they are surprised when the coin crashes — even though the tokenomics made that crash inevitable.
This guide will teach you how to read tokenomics like a professional investor. Not in confusing finance language — in plain English with real examples. By the end, you will be able to look at any crypto project and quickly judge whether its tokenomics support long-term value or guarantee future pain. This one skill alone separates successful crypto investors from people who keep losing money on coins that "looked good".
Why tokenomics matters more than hype
Here is a brutal truth about crypto — 90% of coins launched in the past 5 years have lost most of their value. Not because the technology was bad. Often, the technology was fine. They lost value because the tokenomics were designed poorly.
Let me give you a real-world-style example. Imagine a new coin called "SuperGrid" launches with big hype. The founders claim it will revolutionise electric grids. The website is beautiful. The team has impressive backgrounds. Price launches at ₹5 per token and rises to ₹20 within weeks.
You buy 10,000 tokens for ₹2 lakh at ₹20 each. You feel smart.
Three months later, the founders' tokens unlock. They hold 30% of total supply. They start selling. Venture capital tokens unlock a month after. They hold another 25%. They also sell. Within six months, the token is at ₹1. Your ₹2 lakh is now ₹10,000.
The technology did not fail. The team did not leave. The project is still being built. But the supply unlock schedule destroyed the price because too many tokens flooded the market faster than new demand could absorb them.
This pattern repeats constantly in crypto.
Look at almost any major altcoin disaster and you will find tokenomics-related causes:
- Too much supply held by insiders, dumped on retail.
- Inflation rates too high, diluting existing holders.
- No real utility for the token (just speculation).
- Unrealistic supply caps that broke when the team printed more tokens.
- Staking rewards so high they had to be paid with dilution, crashing the price.
Good tokenomics characteristics:
- Limited or slowly-growing supply
- Fair distribution (no single group holds majority)
- Long vesting periods for team and investors (multi-year, not multi-month)
- Real utility that creates demand (governance, staking with real yield, fee reduction, access)
- Deflationary mechanisms (burns reduce supply over time)
Why most beginners miss this.
Tokenomics is less exciting than price predictions. It is not glamorous. Nobody tweets "SuperGrid has a 3-year linear vesting schedule!". Instead, they tweet "SuperGrid to ₹100 soon!" Easy to understand hype sells. Dry mechanical analysis does not.
But the dry mechanical analysis is what determines who makes money long-term. The hype traders enter at the top, get dumped on when supply unlocks, and exit with losses. The tokenomics-aware investors avoid these coins entirely, or wait until after the major unlock events to consider entry.
You do not need to be a genius to read tokenomics. You just need a checklist and 20 minutes per coin. This guide will give you both. When you combine this with on-chain analysis, you have the two most powerful tools for evaluating any crypto project.
Supply basics — max, circulating, locked
Every crypto project has supply numbers. You will see three main types. Understanding the difference is the first step in tokenomics analysis.
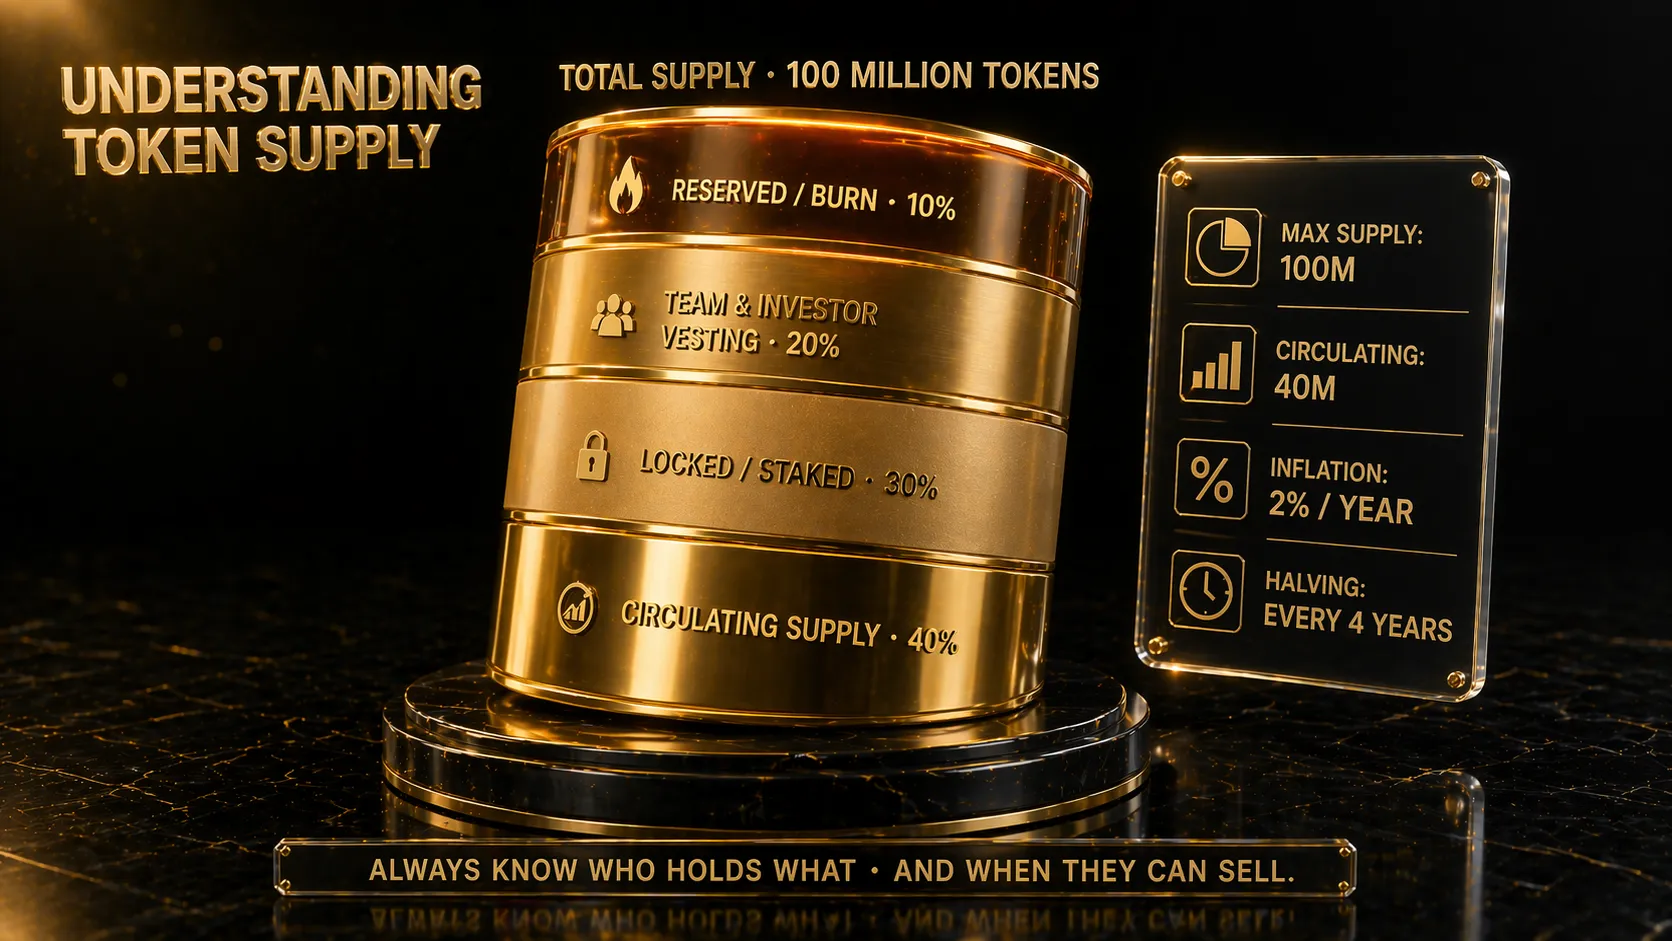
Understanding token supply — always know who holds what and when they can sell.
1. Maximum supply (max supply). The absolute total number of tokens that will ever exist. Once this cap is reached, no new tokens can be created.
Example: Bitcoin has a max supply of 21 million BTC. Ever. This cannot change without consensus from the entire Bitcoin network (which realistically will never happen).
Some coins have no max supply — they have perpetual inflation. Ethereum is one example; there is no hard cap, though various burns can make it net deflationary during high activity. Dogecoin is another — it adds about 5 billion new coins per year forever.
Questions to ask: Is the max supply fixed or unlimited? Is it realistic (Bitcoin's 21 million) or absurd (a random meme coin with 1 quadrillion supply)? Can it be changed by a team decision, or is it locked by code?
2. Circulating supply. The number of tokens that are currently out in the wild, being actively held and traded by people. This is what determines the actual market cap.
Market cap formula: Circulating supply × Current price = Market cap.
Example: Bitcoin has about 19.8 million BTC circulating. At ₹70 lakh each, that is a market cap of roughly ₹138 lakh crore (~$1.7 trillion).
If a coin's max supply is 1 billion but only 100 million are circulating, 900 million tokens are still waiting to enter the market. This is a warning sign — massive future dilution is coming.
3. Locked / non-circulating supply. Tokens that exist but are not currently tradable. These include:
- Team tokens — held by founders and developers, usually locked for 2-4 years
- Investor tokens — held by venture capital, with vesting schedules
- Treasury tokens — held by the project for future development and partnerships
- Staking locks — tokens currently locked to earn staking rewards
- Unmined supply — for proof-of-work coins, tokens not yet mined (like most of Bitcoin was for its first decade)
The ratio of circulating to total supply matters:
- 80%+ circulating: Mature coin with most dilution already absorbed. Bitcoin is at ~94% circulating.
- 40-80% circulating: Still-maturing project. Dilution risk present but manageable.
- Under 40% circulating: Early-stage project with massive future supply pressure. Be very careful.
- Under 20% circulating: Extreme dilution risk. Whatever the hype, much more supply is coming.
A practical warning.
Many newly-launched coins have only 5-15% of their total supply circulating. They trade at sky-high valuations because the market is pricing the small circulating supply. When the remaining 85-95% unlocks over the coming years, massive selling pressure arrives.
The technical term for this is "fully diluted valuation" (FDV). FDV = Max supply × Current price. If a coin has market cap of ₹500 crore but FDV of ₹10,000 crore, there is roughly 20x more supply waiting to hit the market. This is almost always a recipe for long-term price collapse unless demand grows just as fast.
Before buying any coin, check CoinGecko or CoinMarketCap for these numbers. Look at both market cap and FDV. A huge gap between them is one of the clearest warning signs a beginner can learn to spot.
Distribution — who got the tokens first
Knowing how many tokens exist is only half the story. The other half is who has them. Distribution determines whether the project's future is shaped by broad community support or a few insiders.
Where to find distribution data.
Most projects publish this information in their whitepaper or tokenomics page. Look for pie charts showing percentage allocations to different groups. CoinGecko and CoinMarketCap sometimes summarise this too. For verification, block explorers can show you the top 100 wallets.
Typical token allocations in modern crypto projects:
- Team and founders: 15-25% typical (red flag if above 30%)
- Private investors (VCs, seed rounds): 15-25% typical (red flag if above 30%)
- Public sale (ICO/IDO): 10-20% typical
- Community / ecosystem incentives: 10-30% typical (airdrops, rewards, liquidity mining)
- Treasury / reserves: 10-20% typical (for future development and partnerships)
- Staking / mining rewards over time: varies, often perpetual
What good distribution looks like:
The 2015 Bitcoin whitepaper and protocol set a near-perfect example. 100% of Bitcoin had to be mined through proof-of-work. No pre-mine (except the first genesis block). No team allocation. No VC investors. No airdrop. The only way to get BTC was to mine it (earn it through computational work) or buy it on the open market.
Ethereum was less pure but still reasonable. Pre-sale to early believers (not VCs) at fair prices. Small allocation to founders and the Ethereum Foundation. Most supply has since been earned through mining and staking by the community.
Modern projects rarely match this purity, but the good ones try to minimise insider concentration:
- Team + VC combined under 40% total
- At least 30-40% reserved for community rewards, airdrops, and ecosystem growth
- Long vesting schedules (3-4 years) to prevent early dumps
- No single wallet holding more than 5% of supply
What bad distribution looks like:
- Team holds 40-60%: founders can destroy the project at will by selling
- Top 10 wallets hold 70%+ of supply: extreme concentration, easy to manipulate
- Unknown allocation to "private investors": often means insiders who bought at huge discounts
- "Advisors" getting 5-10%: usually means tokens paid to Twitter influencers for promotion
- No community allocation: project values insiders over users
How to check wallet concentration yourself.
For tokens on Ethereum or BSC, visit a block explorer (etherscan.io, bscscan.com). Enter the token's contract address. Click the "Holders" tab. You will see the top 100 wallets by balance.
Look at:
- Top wallet's percentage: Above 20% is worrying. Above 40% is dangerous.
- Top 10 wallets combined: Above 50% is concerning. Above 70% is critical concentration.
- How many of the top wallets are labelled (exchanges like Binance, Coinbase are expected to hold large amounts — that is normal because they custody user deposits)
If you see a single unlabelled wallet holding 30% of supply, that is one person (or small group) who can crash the price any time they decide to sell. Avoid.
Our whale manipulation guide covers how these concentrated holders manipulate prices. Bad distribution is often the setup that makes manipulation easy.
Vesting schedules — the hidden sell pressure
If distribution tells you who currently holds what, vesting schedules tell you when they can start selling. This is one of the most underrated elements of tokenomics — and one of the biggest destroyers of wealth for uninformed buyers.
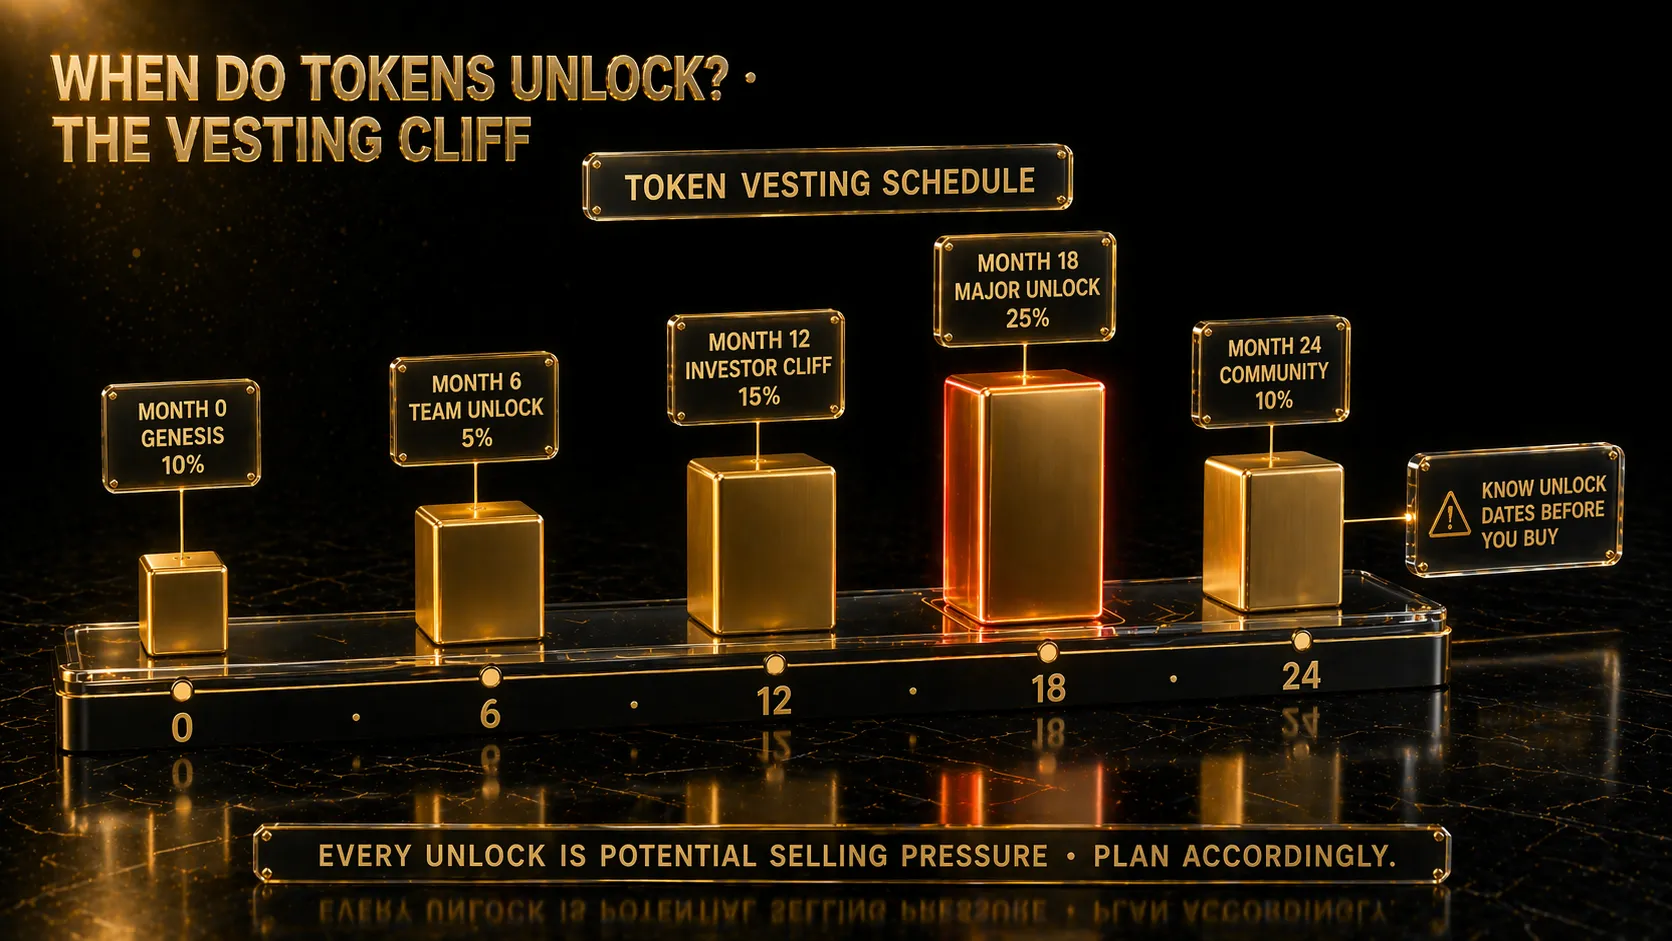
A token vesting schedule — every unlock is potential selling pressure. Plan accordingly.
What is vesting?
When a project launches, team members, VCs, and early investors are usually given large token allocations. If they could sell immediately, they would dump on retail buyers and crash the price in days. To prevent this (or at least delay it), the tokens are locked for a certain period — this is called vesting.
Vesting schedules work in different ways:
1. Cliff vesting. Nothing unlocks for a set period (the cliff), then a big chunk unlocks at once. Example: 12-month cliff, then 25% unlocks on day 365, rest over following months. Cliffs create predictable selling pressure at cliff end.
2. Linear vesting. Tokens unlock gradually over time. Example: over 3 years, 1/36 of tokens unlock every month. No single big unlock event, just continuous small dilution.
3. Combination (most common). A cliff followed by linear vesting. Example: 12-month cliff, then linear vesting over 24 months thereafter. This is the industry standard for VC-backed projects.
"Good" vesting looks like:
- Total lockup period of 3-4 years minimum
- At least 12-month cliff before any insider tokens unlock
- Linear release after the cliff, spread over 2-3 years
- Public announcements of vesting milestones
- Team and VCs subject to the same or longer vesting than early community members
"Bad" vesting looks like:
- Very short cliffs (3-6 months)
- Fully unlocked insider tokens at launch (dump guaranteed)
- Vesting finished within 12 months total
- Cliffs unlocking 30-40% of total supply at once (price crash guaranteed)
- No public vesting information (hidden schedules = insider trading opportunity)
Why this matters for price.
Imagine a token with 100 million circulating and 900 million locked for insiders. Price is ₹100, market cap ₹1,000 crore. When the 900 million unlock, the supply available for trading increases 10x. Unless buying demand also grows 10x (unlikely), price must fall dramatically.
In practice, many insiders sell aggressively the moment they can, because they bought at fractions of a rupee during early rounds. Even after a 90% price crash, they are still profitable from their entry. For them, dumping makes sense. For retail holders who bought at ₹100, the crash is devastating.
Our crypto scam guide covers more patterns like this — many "soft rug pulls" work exactly this way. The project continues, the tokens keep trading, but insiders have extracted their value through planned selling.
How to find a token's vesting schedule.
Start with the project's whitepaper or tokenomics page. Most legitimate projects publish this clearly. If they do not, that is itself a red flag.
For popular coins, sites like TokenUnlocks (token.unlocks.app), CryptoRank, and Messari track upcoming unlock events. Visit these before buying any coin. If a major unlock event is due within 1-2 months of your planned buy, consider waiting until after it passes.
Practical rule: avoid major unlock months.
Experienced investors often wait until after cliff unlocks before buying altcoins. You may miss a few percentage points of upside, but you avoid the 30-50% drops that often follow. This is one of the simplest risk-reduction techniques in all of crypto.
For example, if Token X's team tokens unlock on September 15 and represent 20% of total supply, the weeks around that date often see significant selling pressure. Waiting until October to buy reduces your risk substantially.
Never buy a token without knowing its vesting schedule. Never.
Utility — why does the token exist?
Now for the biggest question — why should this token have any value at all? What does it do? What problem does it solve? If you cannot answer these clearly in one sentence, skip the coin.
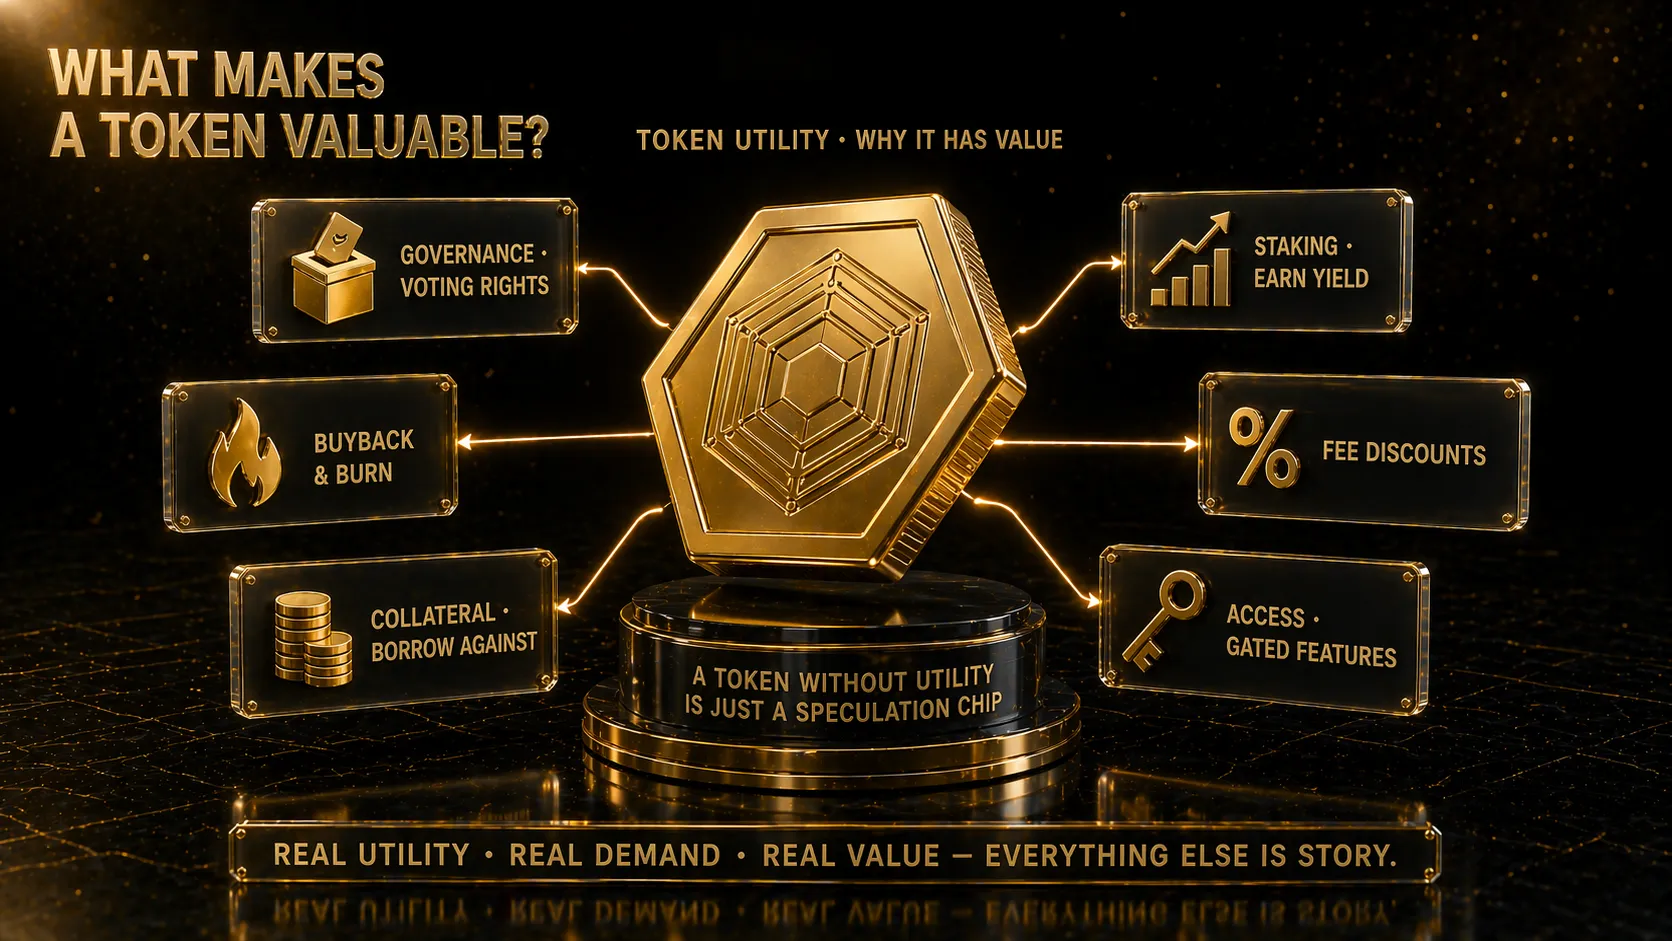
A token with real utility has real demand. Everything else is just story.
Common types of token utility:
1. Store of value (Bitcoin). The primary utility is being scarce, durable, portable, and difficult to confiscate. Like digital gold. Bitcoin's utility is simply "a way to hold wealth that no government can freeze". This utility justifies tremendous global demand.
2. Transaction fees and network access (Ethereum). ETH is required to pay gas fees on the Ethereum network. Every application using Ethereum creates demand for ETH. The more Ethereum is used, the more ETH is needed. This direct utility creates price support.
3. Governance rights. Some tokens let holders vote on project decisions. Holders can vote on new features, treasury spending, protocol changes. Examples: UNI (Uniswap), AAVE (Aave protocol). For utility to matter, the protocol itself must generate real revenue or create real value.
4. Staking rewards with real yield. Holders lock tokens to help secure the network and earn fees from transactions. Important: rewards paid in newly-minted tokens (which dilute supply) are not the same as rewards paid from real protocol revenue. Real yield from fees is sustainable. Dilution-funded yield is not.
5. Fee discounts and access. Exchange tokens like BNB offer discounts on trading fees. Holding BNB has direct financial benefit for traders. This creates organic demand from users who trade often.
6. Collateral for borrowing. In DeFi protocols, some tokens can be used as collateral to borrow stablecoins. This creates holding demand — users hold the token rather than sell it, because they are borrowing against it.
7. Buyback-and-burn mechanisms. Some protocols use part of their revenue to buy tokens from the market and destroy them. This creates a deflationary pressure that supports price over time. Examples: BNB quarterly burns, some DeFi protocols' fee distribution.
Tokens with weak or fake utility:
- "Governance only" tokens with no real governance decisions being made — just theatre.
- "Utility" that is just using the token to pay for the project's own services that nobody actually uses.
- Meme coins with no stated utility — their value comes purely from speculation and trends, not utility.
- "Access" tokens for exclusive content or communities where the content is not worth the token cost.
- Tokens created "because every Web3 project needs one" — no genuine need, just marketing.
A simple test — the utility question.
Ask yourself: "If this token disappeared tomorrow, would the protocol still work? Would anyone actually miss the token itself?" If the answer is no — if the token is not essential to how the protocol operates or if its loss would be trivial — then the token probably has weak utility.
For Bitcoin, if BTC disappeared, the entire point of Bitcoin disappears. Essential.
For ETH, if ETH disappeared, Ethereum cannot function. Essential.
For many altcoins with vague "governance" or "access" claims, if the token disappeared, the project could continue just as well with a different mechanism. Non-essential. These tokens usually decay toward zero over time.
Real utility connects to real demand.
The most important question in tokenomics: where does the demand come from? If demand is only speculation, the token is purely a gambling chip — it can rise in hype cycles and crash when attention fades. If demand comes from real usage (fees, borrowing, staking with real yield, required access), the token has fundamental support that survives through bear markets.
Our DeFi guide covers many protocols where token utility is genuinely strong. Use these as reference cases when evaluating new projects.
Inflation and burns — how supply changes over time
Even after launch, a token's supply can change. It can grow (inflation) or shrink (deflation, usually through burns). Understanding these mechanisms helps you predict long-term price pressure.
Types of inflation:
1. Mining rewards. Proof-of-work coins like Bitcoin create new coins as rewards for miners. Bitcoin's inflation rate has been falling over time (the famous "halvings" cut rewards in half every 4 years). Current Bitcoin inflation is about 1% per year, slowly trending toward zero.
2. Staking rewards. Proof-of-stake coins like Ethereum create new coins as rewards for stakers. Ethereum's base rate is low (currently around 0.5-1% per year), partially offset by burning.
3. Validator rewards. Various networks pay validators new tokens for processing transactions. Most are in the 3-10% annual inflation range.
4. Unlock-driven inflation. Not true inflation, but similar effect. When vested tokens unlock, circulating supply grows. If insiders sell, price drops.
What is a good inflation rate?
Any inflation above 5-7% annually is difficult to sustain unless demand grows faster. Many "high-yield" staking tokens offer 10-20% yields but have similar or higher inflation — meaning the yield just keeps pace with dilution, not above it. Net gain: zero.
Rule of thumb:
- Under 2% inflation: excellent, price-supportive
- 2-5% inflation: acceptable if demand is growing
- 5-10% inflation: concerning, requires strong demand growth to overcome
- 10%+ inflation: very difficult to make money over time
Burns — the opposite of inflation.
A burn means permanently destroying tokens by sending them to a wallet that no one controls (a burn address). Once burned, they are gone forever. This reduces total supply, creating deflationary pressure.
Types of burn mechanisms:
1. Fee burns (Ethereum's EIP-1559). A portion of every transaction fee is burned. During high activity, Ethereum can become net deflationary — more burned than created.
2. Buyback-and-burn programs. The project uses revenue to buy tokens from the market and burn them. BNB does this quarterly, removing about 1% of supply per quarter for years.
3. Transaction burns. Some tokens have built-in burns on every transaction. A percentage (usually 1-2%) is burned with each trade.
Burns sound great for price. But be cautious:
- Small burns do not materially affect supply. A 0.1% annual burn rate is essentially marketing.
- Burns funded by the project team's own token reserves do not create real deflationary pressure. They just reduce the overhang, which is still helpful but different from real burn.
- Transaction burns encourage holders to avoid trading, which reduces liquidity and volume.
Calculating net inflation for any coin.
True inflation = New tokens created minus tokens burned. If a coin has 5% annual creation and 3% annual burns, net inflation is 2%. If creation is 3% and burns are 5%, net deflation is 2%.
For good projects, this information is public. Check the project's tokenomics page or token-economic data on CoinGecko. If the project hides this, treat it as a red flag.
The long-term view.
Over 5-10 years, the cumulative effect of inflation and burns is massive. A coin with net 10% annual inflation will have roughly 160% more tokens after 10 years. For price to hold, demand would need to grow at least 160%. For price to rise meaningfully, demand must grow much faster than that.
A coin with net 2% annual deflation becomes more scarce over time — price support strengthens even if demand is flat. These are the coins that have historically outperformed over long periods.
When evaluating any long-term crypto investment, always calculate net inflation. Many exciting-looking projects fail this test when you do the math honestly. The ones that pass tend to be the ones that keep creating wealth decade after decade.
Red flags that save you from bad projects
After all the detailed analysis, here is a consolidated red-flag checklist. If a token fails any of these, seriously reconsider buying it. If it fails several, walk away entirely.
Supply red flags:
- Max supply above 10 billion (or worse, trillion) — usually a sign of lazy tokenomics
- Circulating supply under 30% of max — massive future dilution coming
- FDV (fully diluted valuation) is more than 3-5x higher than current market cap — huge supply overhang
- Supply cap can be changed by team decision without holder vote
- Supply numbers are not clearly published anywhere
Distribution red flags:
- Team allocation above 25% of total supply
- VC + private investor allocation above 30%
- Combined insider allocation (team + VC + advisors) above 50%
- Single wallet holds more than 10% of supply (excluding exchange custody wallets)
- Top 10 wallets hold more than 70% of supply
- "Advisors" or "marketing" allocated more than 3-5%
Vesting red flags:
- Team or VC tokens have cliff less than 12 months
- Total vesting period shorter than 3 years
- Large cliff unlock (30%+ of supply at once)
- Team already sold tokens in the past (if public info)
- Major unlock event within 3-6 months of your planned purchase
- No public vesting schedule available
Utility red flags:
- You cannot explain what the token does in one sentence
- "Utility" is vague — "powers our ecosystem" is not utility
- Token is not essential to the protocol working
- Only utility is governance, but no real decisions are being made
- High staking yields (20%+) but no explanation of where they come from
- Protocol has no real users or revenue
Economic red flags:
- Net inflation above 10% annually
- Staking rewards funded entirely by dilution (not real revenue)
- No burns or anti-dilution mechanisms
- Revenue model unclear or non-existent
- Tokenomics can be changed by team vote without holder input
Team and communication red flags:
- Team is fully anonymous (not just pseudonymous — totally unknown)
- No public track record for team members
- Whitepaper has no technical detail, just marketing fluff
- Website has grammar/spelling errors and unprofessional design
- Social media activity is all hype, no substance
- Cannot find any independent audits or third-party reviews
- Project cannot explain its tokenomics in clear terms
VIDYA MANDAL — Evaluate any crypto in 20 minutes
VIDYA MANDAL is our structured knowledge library covering tokenomics deep-dives, real case studies of projects that succeeded or failed based on their tokenomics, and practical evaluation checklists you can apply before buying any coin. If you want to avoid the next wave of altcoin wipe-outs, this skill matters more than any technical indicator.
Explore the Store →A final practical approach.
For every crypto you are considering, spend 20 minutes answering these questions:
- What is the max supply? Current circulating supply? FDV vs market cap?
- Who holds the supply? What percent is with team and insiders?
- What is the vesting schedule? When are the next major unlocks?
- What does the token actually do? Why would anyone need to hold or buy it?
- What is the net inflation rate after accounting for burns?
- Are there any serious red flags from the list above?
If you cannot answer all six in 20 minutes of research, you do not understand the project well enough to invest. Either keep researching or skip the coin.
This simple discipline, applied consistently, will save you from 80-90% of the bad investments that drain retail portfolios. It will not make you rich overnight — but it will keep you alive long enough to be rich eventually. Combine this with on-chain analysis and scam awareness, and you have a proper investment framework that most retail traders never develop.
Join our Telegram community where we discuss tokenomics of both established and new projects. Our crypto education courses include detailed tokenomics modules with case studies. Research first. Buy later. This is how patient investors beat impatient traders over full market cycles.
Frequently Asked Questions
What is the most important tokenomics metric for beginners to check?
Start with the ratio of circulating supply to max supply. If less than 30% of tokens are circulating, massive future dilution is coming — even great projects struggle to hold price during large unlock waves. Also compare market cap to fully diluted valuation (FDV). If FDV is 3-5x higher than current market cap, expect significant price pressure as new tokens enter circulation over time.
How can I check a token's vesting schedule?
Start with the project's official whitepaper or tokenomics page — legitimate projects publish this openly. For popular tokens, sites like TokenUnlocks, CryptoRank, and Messari track upcoming unlock events across many projects. Never buy a token without knowing when major unlocks occur. A common strategy is to wait until after scheduled cliff unlocks before buying, since prices often drop during these events.
What percentage of a crypto token should be held by the founding team?
Generally, 15-25% is a reasonable team allocation. Above 25% becomes concerning. Above 30% is a serious red flag — founders can single-handedly crash the price by selling. The team allocation should also have long vesting (3-4 years minimum) to align their incentives with long-term project success, not short-term exits.
Are high staking yields always good in tokenomics?
No, often they are a warning sign. Always check where the yield comes from. Yields funded by real protocol revenue (transaction fees, lending interest) are sustainable and genuinely good. Yields funded by minting new tokens (dilution) just keep pace with inflation — you earn more tokens but each is worth less. 20%+ yields in new projects are almost always dilution-funded and unsustainable.
Can a crypto project have good technology but bad tokenomics?
Absolutely yes, and this is one of crypto's saddest patterns. Many technically brilliant projects have destroyed holder wealth through poor token design — excessive insider allocations, short vesting, high inflation, or weak utility. Strong technology without strong tokenomics often leads to price failure regardless of adoption. Always evaluate both together; one without the other is not enough for successful investment.
This article is for educational purposes only and does not constitute financial advice. Crypto investments are subject to market risk and are not regulated by SEBI or RBI in India. Past performance does not guarantee future results. Always do your own research, consult a registered financial advisor, and never invest more than you can afford to lose. cRyPtO sMaRt and Avik Kanrar are not liable for any trading decisions or losses based on this content.