
- What is on-chain analysis, in simple words?
- Why the blockchain is different from regular markets
- The three types of on-chain data you should know
- How to track whale wallets
- Reading exchange inflows and outflows
- On-chain metrics that often predict price moves
- Free tools anyone can use
- Mistakes beginners make with on-chain data
- Frequently asked questions
What is on-chain analysis, in simple words?
On-chain analysis means studying the data that lives on the blockchain. And the blockchain is a public record book. Every crypto transaction ever made is written there. Anyone in the world can read it, for free, at any time.
Think of it like this. Imagine you had a magic notebook where every time money moved anywhere in the world, a new line was automatically written. You could see who sent what, when, and to whom. You cannot see names (only wallet addresses). But you can see all the movement. That is what the blockchain is for crypto.
Most traders only look at the price of a coin. They stare at charts going up and down. But the price is just the final result. On-chain analysis lets you look behind the price. You can see:
- Which wallets are buying and which are selling
- How much crypto is moving into exchanges (ready to be sold)
- How much is moving out of exchanges (being held for long term)
- What big wallets (called whales) are doing
- How many people are using the network each day
This is powerful because it shows you what people are actually doing with their money, not just what they are saying on Twitter or news. Actions speak louder than words. And in crypto, every action is public.
For example: if 50,000 Bitcoin suddenly moves from a private wallet to a major exchange, something big might happen. That amount of Bitcoin only moves to an exchange when someone is planning to sell it. So you can prepare for a possible price drop — while most traders have no clue what is coming.
This is not magic. And it is not a crystal ball. On-chain data does not tell you the future. But it tells you the context behind price moves. Once you learn to read it, you start seeing the market as a professional does — from the inside, not just the outside.
Why the blockchain is different from regular markets
If you have traded stocks before, you will notice something strange about crypto. In the stock market, most trading data is private. You know the total daily volume, but you do not know who bought what. You cannot see that HDFC Bank executives sold ₹50 crore in one morning, unless they officially disclose it.
Crypto is the opposite. Every wallet's activity is fully public. Every transaction is written in the public ledger. You can see:
- How much crypto any wallet holds, right now
- The full history of every transaction, going back to when Bitcoin launched in 2009
- When a wallet last moved any coins
- How old each coin in a wallet is (called "coin age")
What you cannot see is the real-world name attached to a wallet. A wallet address looks like this: bc1qxy2kgdygjrsqtzq2n0yrf2493p83kkfjhx0wlh. You do not know if that wallet belongs to a person in Mumbai or a company in New York. But analysts have been tracking wallet patterns for years, and many major wallets are now "labelled". For example, the wallets belonging to Binance, Coinbase, or the FTX bankruptcy estate are all known.
This transparency gives ordinary traders something they never had before — a way to see what smart money is doing, almost in real time. In traditional markets, this information is only available to insiders and large institutions. In crypto, it is available to anyone who learns to read it.
This is why on-chain analysis is becoming the most important skill in crypto. Technical analysis (reading charts) tells you what has happened to price. Fundamental analysis tells you the quality of a project. On-chain analysis tells you what the biggest players are doing right now. Combining all three gives you a much fuller picture than most retail traders ever see.
The three types of on-chain data you should know
On-chain data can look overwhelming at first. Hundreds of metrics, strange names, complex charts. But you only need to understand three basic types to get most of the value.
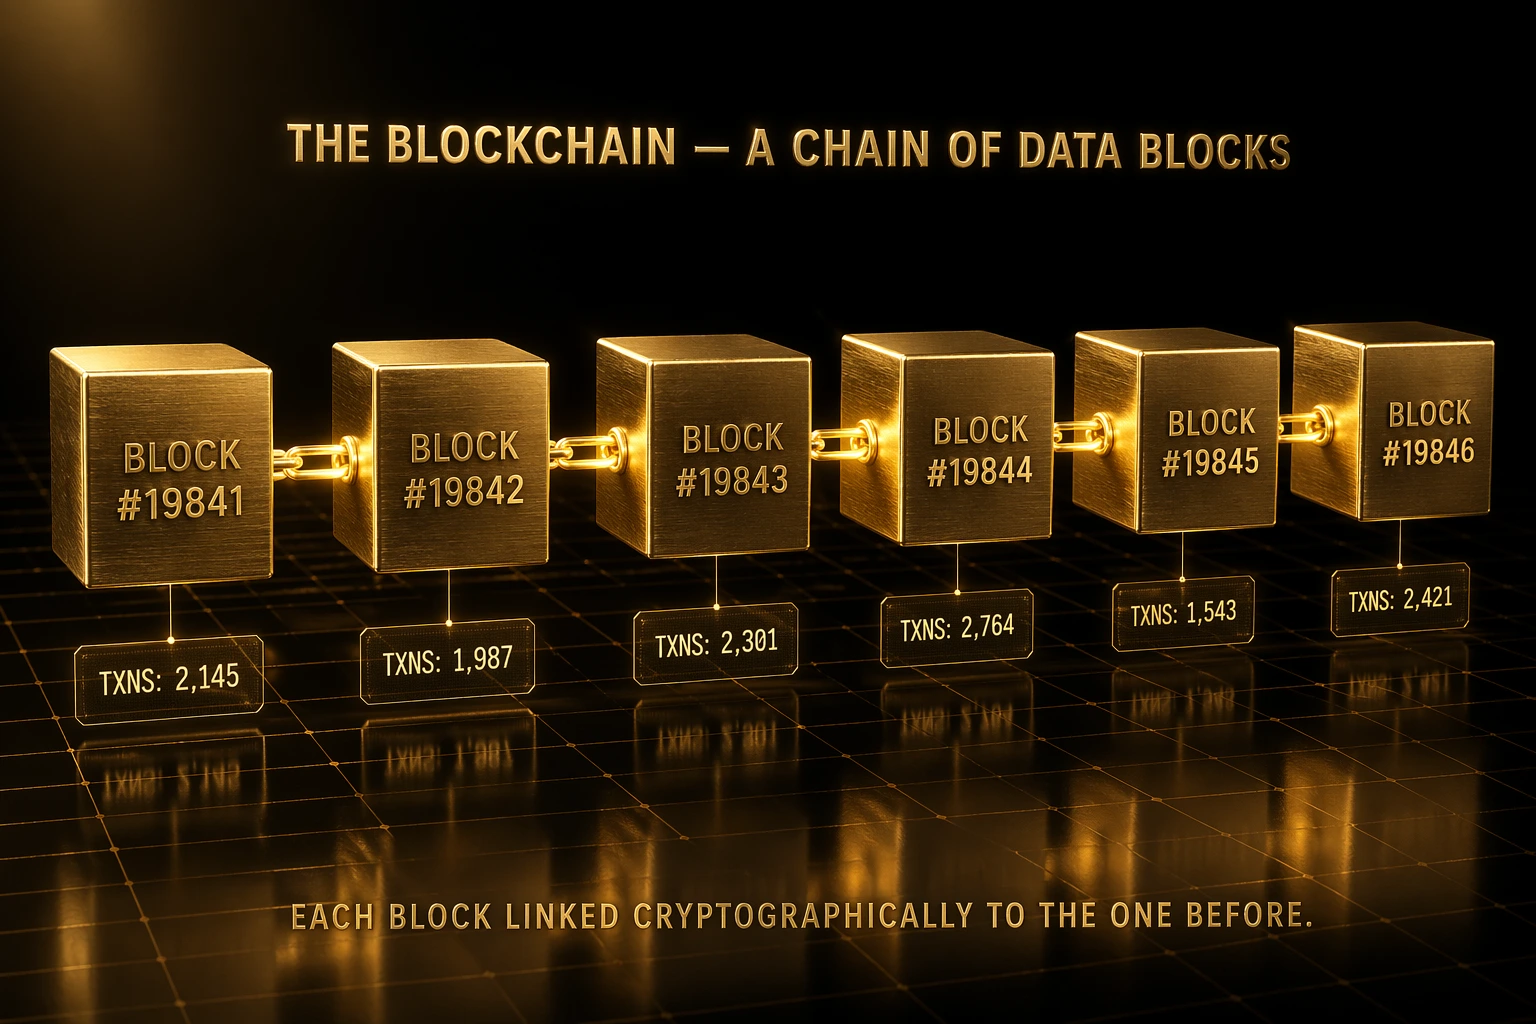
Each block in the blockchain is a public ledger entry — anyone can read the data inside.
Type 1 — Transaction data (flow). This is about movement. How much crypto is moving, between which wallets, at what times. This is the raw data of what is happening. Examples: "45,000 BTC moved from wallet A to wallet B at 3 PM yesterday", or "total daily transactions on Ethereum are up 30% this week".
Type 2 — Address data (who). This is about wallets themselves. How many wallets exist? How many are active today? How are wallets grouped by size (big wallets vs small)? Examples: "there are 1.2 million wallets holding at least 1 BTC", or "15,000 new wallets were created yesterday".
Type 3 — Network data (health). This is about the overall network. How busy is it? How expensive are transactions? How many coins are mined or staked? Examples: "Bitcoin hash rate is at an all-time high" (meaning network is very secure), or "Ethereum gas fees are at 30-day low" (meaning cheaper to transact).
For beginners, the most useful data is Type 1 (flow) and Type 2 (addresses). Type 3 (network health) matters more for long-term investment decisions, not day-to-day trading.
Here is a simple way to remember it. Type 1 answers "what is moving?". Type 2 answers "who is moving it?". Type 3 answers "how is the overall network doing?". Together, they give you a complete picture.
You do not need to check all three every day. For most traders, looking at whale activity and exchange flows (both part of Type 1) once or twice a week is enough. That alone will put you ahead of 95% of retail traders who never look at on-chain data at all.
How to track whale wallets
A whale is a wallet that holds a very large amount of crypto. In Bitcoin, a wallet holding more than 1,000 BTC is usually called a whale. In Ethereum, more than 10,000 ETH. These wallets are often owned by early miners, large investors, exchanges, or institutions.
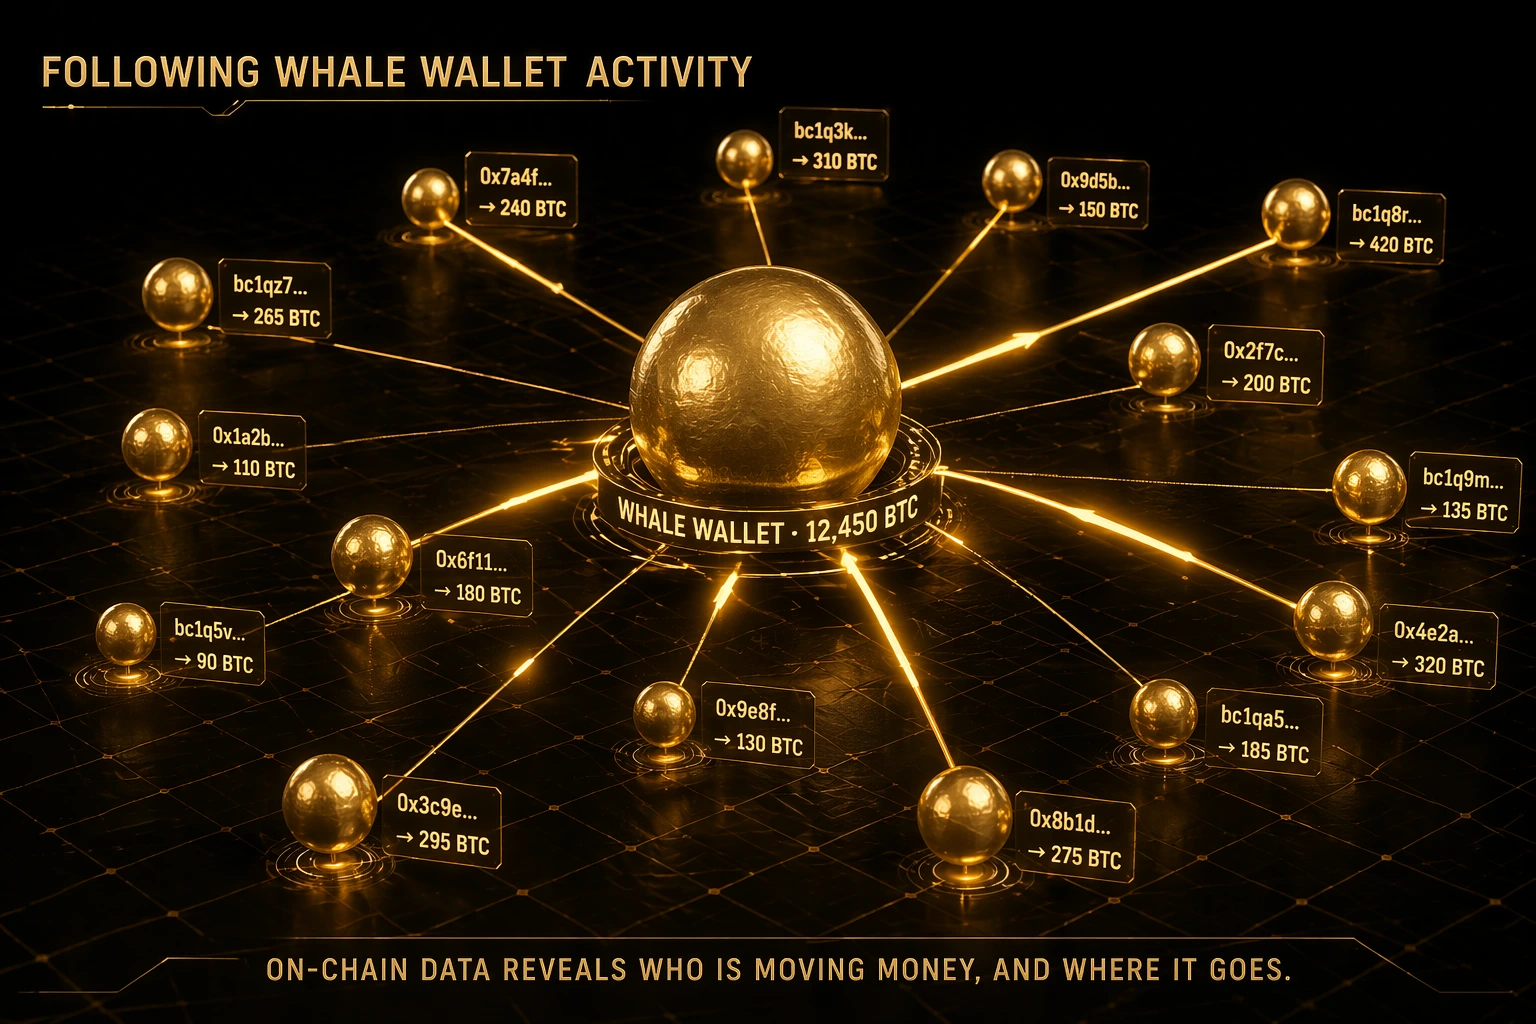
Tracking whale wallets reveals how big players accumulate or distribute — often before prices react.
Whales matter for one simple reason: their orders are large enough to move the market on their own. If a whale sells 5,000 BTC at once, the price drops — even if retail traders are buying at the same time. Watching what whales do gives you early warning about market moves.
What to look for when tracking whales:
1. Accumulation vs distribution. Are whales slowly adding to their positions, or slowly reducing them? Accumulation (buying) over weeks often happens before major bull moves. Distribution (selling) over weeks often happens before major drops.
2. Sudden large transfers. When a single whale moves a huge amount — say, 10,000 BTC — to an exchange, that is a warning sign. It usually means a sell is coming. When a whale moves large amounts off an exchange to a private wallet, it often means long-term holding (bullish).
3. New whale wallets appearing. When multiple new whale-sized wallets start buying in the same period, it is often a sign that big money is entering the market quietly — good for future prices.
4. Old coins waking up. Some whale wallets have held coins for 5-10 years without moving them. When these "sleeping" wallets suddenly become active, it usually means something important is about to happen.
You do not need to do any complex analysis yourself. Free tools like Whale Alert (whale-alert.io) publish large transactions in real time. Following their Twitter account alone keeps you informed about every major whale movement as it happens. For deeper tracking, tools like Arkham Intelligence and Nansen offer labelled wallet data — you can see exactly which famous wallet is doing what. Be aware that whales often try to manipulate retail traders — our whale manipulation guide covers how they do it.
Reading exchange inflows and outflows
Exchange flows are one of the most reliable on-chain signals. They are simple to understand and often predict big price moves.
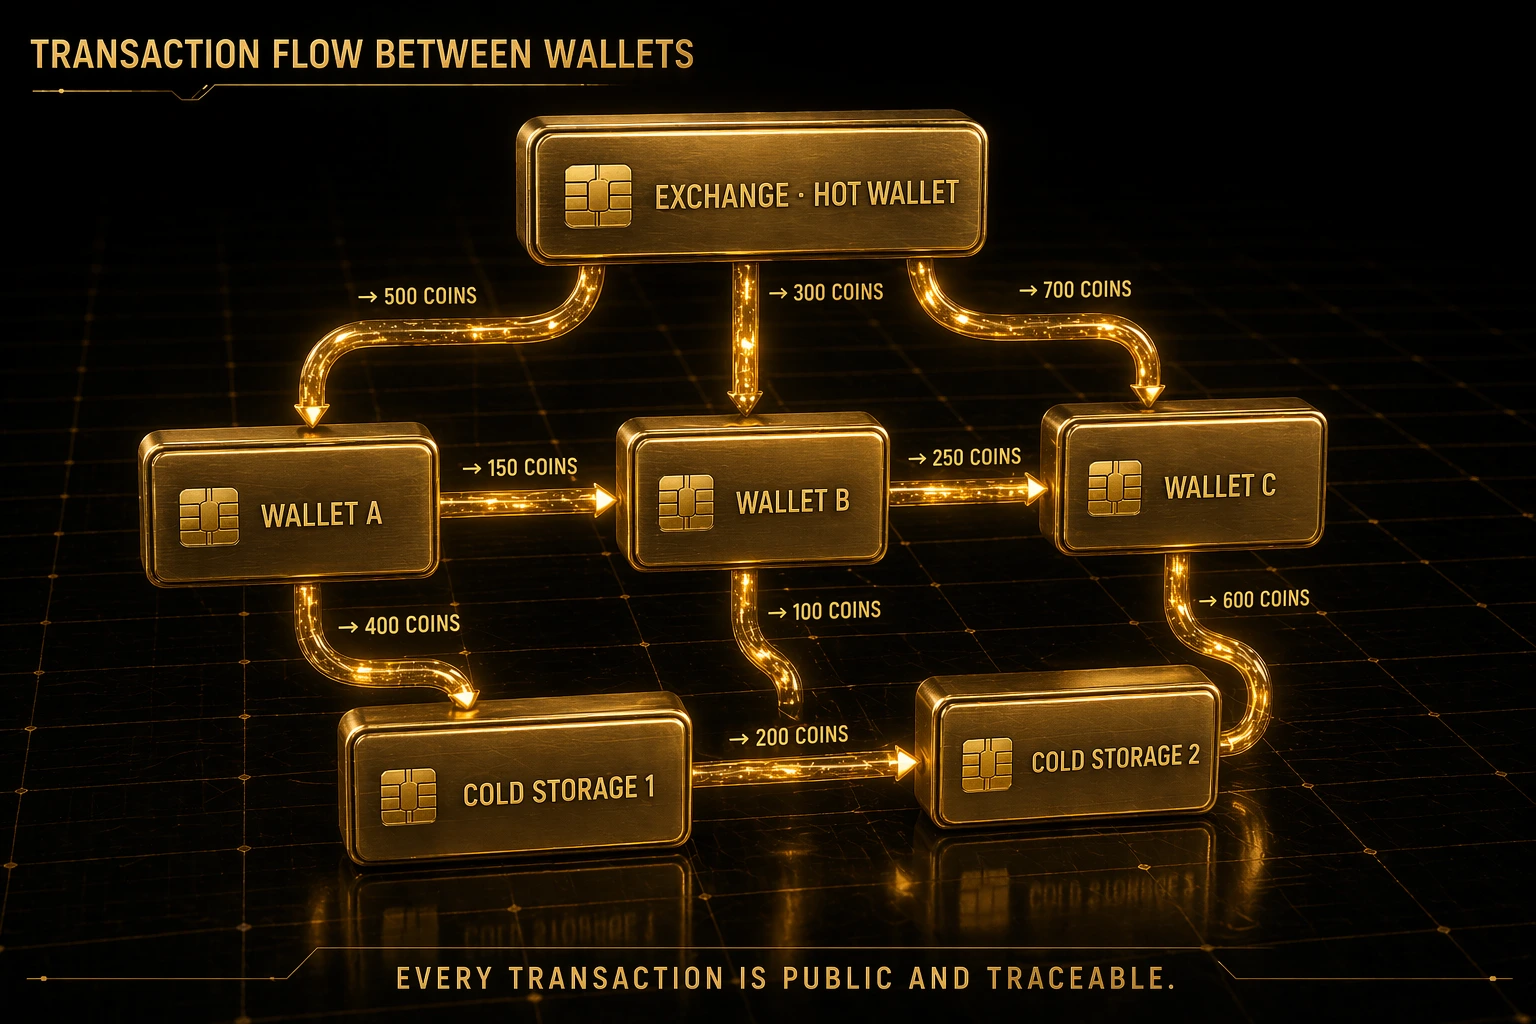
Following coins between personal wallets and exchanges reveals buying and selling pressure in real time.
The basic idea: when people plan to sell crypto, they move it to an exchange first. You cannot sell Bitcoin sitting in your own wallet — it has to be on an exchange. So:
Inflows to exchanges = potential selling pressure. When large amounts of crypto flow into exchanges, it often means sellers are preparing to sell. This can cause price drops.
Outflows from exchanges = potential buying or holding. When crypto flows out of exchanges to personal wallets, it usually means people are taking their crypto off to hold long-term. This reduces the supply available for sale, which is bullish.
How to use this in practice:
Check Bitcoin exchange reserves weekly. If reserves are falling steadily (people moving off exchanges), it is usually bullish for price over the next weeks or months. If reserves are rising fast (people moving to exchanges), it is often a warning sign.
Real example patterns:
- In late 2020 and early 2021, Bitcoin exchange reserves dropped sharply as large investors moved BTC off exchanges. Price later rose from $20,000 to $69,000.
- During major market tops, exchange inflows typically spike as traders move coins to sell. This has happened consistently at cycle peaks.
- During deep bear markets, outflows often resume as long-term buyers start accumulating — usually a sign the bottom is near.
The useful thing about exchange flows is they work on longer timeframes — weeks and months, not minutes. This matches how most beginners invest. You do not need to watch charts all day. Checking exchange flows once a week is enough for a swing trader or long-term holder. This kind of slow signal works especially well combined with market cycle analysis — if exchange reserves drop sharply during the late accumulation phase, the next bull run is often closer than most people expect.
On-chain metrics that often predict price moves
Beyond whale tracking and exchange flows, several more advanced on-chain metrics have historically been very useful. You do not need to calculate any of these yourself — free websites show them all. But you should understand what they mean.
MVRV Ratio. MVRV stands for "Market Value to Realised Value". In plain English: it compares the current price to the average price at which all coins were last bought. When MVRV is high (above 3-3.5), most holders are in large profit — and many will be tempted to sell. This often signals market tops. When MVRV is low (below 1), most holders are in loss — often a good long-term buying zone.
SOPR (Spent Output Profit Ratio). SOPR measures whether coins being sold are in profit or loss on average. SOPR above 1 means sellers are taking profit (bullish momentum). SOPR dropping below 1 often marks a capitulation event (where sellers are exiting at loss, typically near bottoms).
Active Addresses. The number of unique wallets active each day. Growing active addresses means more people are using the network, which is long-term bullish. Falling active addresses during a price rally is a warning sign — prices are going up without real usage backing them.
Hash Rate (for Bitcoin). This measures the total computing power securing the Bitcoin network. A rising hash rate means miners believe in the long-term future. Hash rate dropping sharply can sometimes indicate stress or miner capitulation, which has often marked bear market bottoms.
Stablecoin Supply. This is the total amount of USDT, USDC, and other stablecoins in circulation. When stablecoin supply grows fast, it means money is entering crypto waiting to be deployed — usually bullish. When it shrinks, it can mean money is leaving the ecosystem.
Long-Term Holder Supply. This counts coins that have not moved in more than 155 days. When long-term holders (experienced investors) keep accumulating during fear, it is usually a sign the market has more upside ahead. When they start distributing during greed, a top may be near.
You do not need to memorise all these today. Start with MVRV and active addresses. Once you are comfortable, add SOPR and stablecoin supply. These five metrics together, checked weekly, give you most of the edge on-chain analysis can offer. Combine them with what you learn from tokenomics analysis for a complete view of what makes a coin valuable.
Free tools anyone can use
On-chain data used to be expensive. Only hedge funds could afford it. Today, powerful tools are available completely free. Here are the ones every beginner should bookmark.
1. Glassnode (glassnode.com) — free tier. Offers dashboards with the most important on-chain metrics. Their free tier covers MVRV, SOPR, active addresses, and exchange balances for Bitcoin and Ethereum. The interface is clean and beginner-friendly. Their research blog is also excellent for learning.
2. CryptoQuant (cryptoquant.com) — free tier. Excellent for exchange flow data and miner behaviour. Their daily exchange reserve charts are the easiest way to see inflow/outflow trends. Free access covers most of what beginners need.
3. Whale Alert (whale-alert.io). Real-time notifications of large transactions. Follow their Twitter account (@whale_alert) — it posts every major transfer as it happens. Great for staying informed about big whale movements without any effort.
4. Etherscan (etherscan.io) and BscScan (bscscan.com). These are block explorers. They let you look up any wallet address, token contract, or transaction on Ethereum and BSC. Essential tools when you want to verify something specific.
5. Santiment (santiment.net) — free tier. Combines on-chain data with social media data. Useful for spotting sentiment spikes alongside on-chain movement.
6. IntoTheBlock (intotheblock.com). Gives you at-a-glance summaries of key on-chain signals for each major coin — concentration of holders, in-profit percentage, large transaction activity. Good for quick daily check-ins.
7. Arkham Intelligence (arkhamintelligence.com). Advanced but has a free tier. Their wallet labels let you see exactly which exchange, institution, or major player owns which wallet. Very useful for serious whale tracking.
How to actually use these tools:
Do not try to use all seven at once. Pick two or three to start. A good beginner setup:
- Daily: Follow @whale_alert on Twitter. Check IntoTheBlock for quick summaries on your top coins.
- Weekly: Visit Glassnode or CryptoQuant to check exchange reserves and MVRV.
- When making big decisions: Check Etherscan for specific wallet activity, Arkham for labelled whale movement.
15-30 minutes per week is enough to stay well-informed on on-chain trends. That is less time than most people spend watching crypto YouTube videos that tell them nothing new.
Mistakes beginners make with on-chain data
On-chain analysis is powerful. But like any powerful tool, it can be misused. Here are the most common beginner mistakes — avoid all of them.
Mistake 1 — Over-reacting to individual transactions. You see one 5,000 BTC transfer to an exchange and panic-sell. But maybe it was an internal transfer between two wallets of the same exchange (called a "hot wallet to cold wallet" rebalancing). Or it was a whale swapping BTC for stablecoins without actually affecting market supply. Always look at trends and patterns over days and weeks, not single events.
Mistake 2 — Confusing exchange transfers with sells. Moving coins to an exchange is not the same as selling them. The coins could sit there for weeks before being sold, or never be sold. Inflows to exchanges indicate potential selling pressure, not confirmed selling.
Mistake 3 — Using on-chain data as the only signal. On-chain data is one piece of the puzzle. Combine it with technical analysis (charts), cycle analysis, and overall market sentiment. An on-chain bullish signal during a macro bearish environment can still lead to losses.
Mistake 4 — Ignoring context. A 100,000 BTC outflow means something different during a bull market than during a bear market. Always ask: what phase of the cycle are we in? What is happening in the wider world? Data without context is dangerous.
Mistake 5 — Paying for expensive tools before you need them. Free tools cover 90% of what beginners need. Do not pay ₹10,000-50,000 per month for advanced analytics platforms when you cannot yet read the basic charts they produce. Master the free tools first.
Mistake 6 — Trying to become a full-time on-chain analyst. You do not need to be an expert. Spending 15-30 minutes per week is enough for most investors. Going deeper than that has diminishing returns for retail traders.
Mistake 7 — Trusting any single metric too much. No single on-chain metric is perfect. Each has false signals. Always confirm one signal with another. If MVRV says "overvalued" but SOPR says "normal", wait for agreement before acting.
Mistake 8 — Acting too fast on whale movements. Even after a whale sells, price moves can take days or weeks to unfold. Do not panic-exit the moment you see one whale transaction. Give the market time to show direction. For deeper understanding of how prices actually form after whale moves, our volume profile guide pairs well with on-chain analysis.
VIDYA MANDAL — Read the blockchain like a professional
VIDYA MANDAL is our structured knowledge library covering on-chain analysis step-by-step — whale wallet tracking, exchange flow reading, the key metrics that matter, and how to combine on-chain signals with price action. If you want to develop the skill that most retail traders never build, this is the place to start.
Explore the Store →A final thought. Every trader has access to the same charts and the same news. What separates the top 5% from the rest is often what they know from data others are not reading. On-chain analysis is that data. It is free. It is public. It is powerful. The only barrier is learning to read it. And that skill, once learned, lasts a lifetime.
Join our Telegram community where we share notable on-chain movements as they happen. Our crypto education courses include a full module on on-chain analysis with live case studies. Start small. Check data weekly. Over time, the patterns become obvious — and you start seeing the market the way insiders do.
Frequently asked questions
Is on-chain analysis only for experts, or can beginners use it too?
Beginners can use it too. You do not need to calculate anything — free websites show all the data ready to read. Start with two simple things: follow Whale Alert on Twitter for big transaction updates, and check Glassnode or CryptoQuant once a week for exchange reserve trends. That alone gives you more insight than 95% of retail traders.
What are the best free on-chain analysis tools for 2026?
Glassnode and CryptoQuant both have strong free tiers covering exchange flows and key metrics. Whale Alert provides real-time large-transaction notifications. IntoTheBlock offers at-a-glance summaries for individual coins. Etherscan and BscScan let you verify any specific wallet or transaction. Together, these cover most beginner-to-intermediate needs without spending a rupee.
Can on-chain analysis predict crypto prices?
No single method can predict prices with certainty. On-chain data is very useful for identifying trends and context — for example, spotting likely market tops when whales are distributing to exchanges, or likely bottoms when long-term holders are accumulating during fear. Use it as one signal among many (with technical analysis and cycle analysis), not as a crystal ball.
How often should I check on-chain data as a beginner?
For most beginners, 15-30 minutes per week is enough. Check exchange reserve trends and major whale movements weekly. Daily checks are only useful if you are actively trading. Long-term investors can get away with monthly reviews. Over-checking leads to over-trading, which usually hurts returns.
Is on-chain analysis different for Ethereum versus Bitcoin?
The core ideas (whale tracking, exchange flows) apply to both. However, Ethereum has unique metrics around smart contract activity, gas fees, and DeFi usage that Bitcoin does not have. Bitcoin has unique metrics around mining (hash rate, miner holdings) that Ethereum does not have. Start with whichever coin you hold most, then expand.
cRyPtO sMaRt is not registered with SEBI and does not provide investment advice. Crypto trading carries significant risk of capital loss. The strategies, examples, and opinions shared in this article are for educational purposes only. Always do your own research and consult a SEBI-registered financial advisor before investing real capital. Past performance does not guarantee future results.